This stock-market pullback probably has further to go: analysts
- BAML analyst: Stocks will get seasonal bump in November-April -
The new mantra for investors this week may be good things come to those who wait.
Wall Street pundits on Monday continued to urge caution, predicting that the stock market turbulence is far from over. Yet many of them ended their commentary on an optimistic note, suggesting that the bullish backdrop for stocks remains intact.
Stephen Suttmeier, a technical research analyst at Bank of America Merrill Lynch, said there are plenty of oversold stocks and bearish sentiment is on the rise but the market has not quite deteriorated to a point where the negative trend turns into a contrarian indicator to buy.
"More time and downside tests may be needed for a firm market low," said Suttmeier in a note to clients.
One technical indicator the analyst is watching is the CBOE 3-month Volatility Index/CBOE Volatility Index ratio which closed at 0.863 on Oct. 11, the "most fearful oversold" since it dipped to 0.758 on Feb. 5.
"Spikes below 1.0 on the VXV/VIX have suggested tactical capitulation and have coincided with important lows on the S&P 500, but these lows sometimes get retested," he said.
About 46% of S&P 500 stocks are above their 200-day moving averages, the lowest since early 2016, while 12% of stocks were hitting 52-week lows as of last week.
"This deterioration is seen across all the major U.S. equity averages and suggests a weakening or later stage bull trend from early 2016," he said.
For now, the S&P 500 is trading above its 12-month moving average while its monthly moving average convergence divergence (MACD) - a momentum indicator that illustrates the relationship between two moving averages of prices, remains a buy signal. But if the S&P 500 12-month moving average falls below 2,747 and the monthly MACD switches to a sell signal, the risk for a bear market will rise, according to Suttmeier.
Another metric to keep an eye on is the high-yield option adjusted spread-the premium that investors demand in return for owning riskier debt over investment grade.
"The big level to watch on the high yield OAS is 3.68-3.72 (2018 peaks). A break above this level would point to increasing credit market stress and likely confirm a failed breakout in the S&P 500 ahead of a bigger equity market pullback," the analyst said.
The high-yield OAS traded at 3.44 last week.
Key support ranges to monitor for the S&P 500, levels where investors feel comfortable about buying back into the market, are 2,729 to 2,710 and then 2,692 to 2,676.
But as bad as things look, there are reasons to be upbeat.
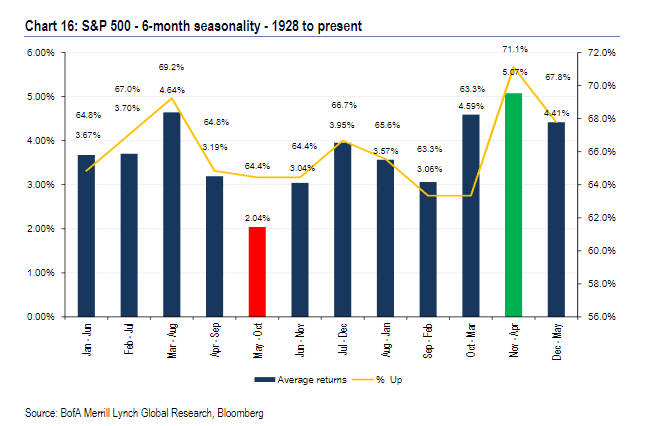
"Many people focus on 'sell in May and go away' but the better and much less well known pattern for the market is 'buy in October and stay'," said Suttmeier, who pointed out that November to April is a good time for stocks.
Going back to 1928, this six-month period has been up 71% of the time for an average return of 5.07%. This time, it could be even more bullish given the traditional boost from a midterm election year, he added.
Tony Dwyer, chief market strategist at Canaccord Genuity, likewise predicted that it could take some time for the pullback to resolve itself.
"We find it unlikely there will be a V bottom given the sharpness and breadth of the correction," he wrote in a Monday note.
In fact, he went as far as to hint that the market's rally to 3,200, which he had predicted by the end of the year, could be delayed into 2019 depending on how long it takes for the market to bottom. However, he stopped short of revising his outlook and reiterated his view that the current period of weakness is likely to be temporary.
"It is essential to remember that while any number of fundamental excuses could be used, this correction was born out of 1) excessive optimism; 2) an extreme intermediate-term overbought condition; and 3) historically low volatility - rather than a significant enough fundamental change that would suggest a shutdown of credit, and ultimately negative EPS," he said.
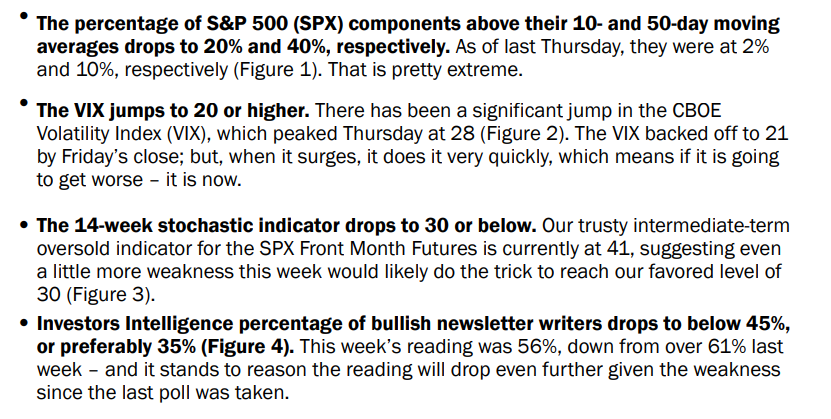
Here is Dwyer's checklist of tactical indicators to watch:
Meanwhile, David Kostin, chief U.S. equity strategist at Goldman Sachs, reminded investors that 5% drawdowns are fairly common.
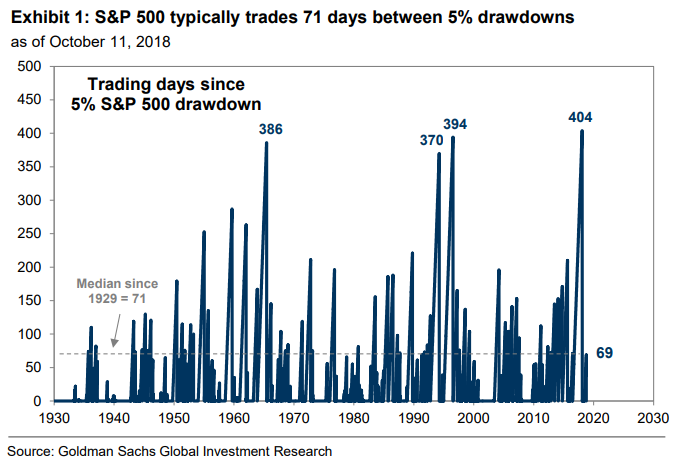
"Since 1928, the index has typically suffered a 5% pullback once every 71 trading days. 69 trading days elapsed between 5% drawdowns prior to Thursday," he said.
The good news, though, is that Goldman strategists do not see much significant upside to bond yields and expect the 10-year Treasury yield to close out the year at 3.1% compared with 3.161% currently.
Kostin stuck with his year-end S&P 500 target of 2,850, noting that the probability of a recession in the next three years is roughly 37%.
"The year to date surge in EPS combined with a modest climb in S&P 500 has reduced forward P/E multiples by 14% to 15.7 times, reducing valuation risk for equity investors," he said.
One indicator that Kostin finds encouraging is the strong return on equity, a popular gauge for corporate profitability, which rose to 17.5% in the second quarter, among the highest in the past 40 years. Excluding financials, ROE hit a record of 20.7%.
Still, the strategist expects companies to feel some margin pressure given higher interest rates and recommended investors to focus on corporations with strong balance sheets such as TripAdvisor Inc., Under Armour Inc., Chipotle Mexican Grill Inc., Marathon Oil Corp. and Amgen Inc.
Stocks resumed their march south following a reprieve on Friday with the S&P 500 off 0.6%, the Nasdaq down 0.9% and the Dow Jones Industrial Average shedding 0.4%.
From MarketWatch