
News-driven market moves are inherently flawed. As soon as the news fades, so too does its impact, leaving stocks at levels investors aren't quite sure what to do with. On the other hand, sometimes news-prompted volatility is just what the market ordered, imposing trading action that stock should push through anyway but just can't.
This week's action thus far looks more like the latter than the former. Monday's steel selloff and Tuesday's follow-on loss were largely prompted by word that a trade deal with China might not take shape for many more months. But, stocks were overbought/overextended well before Monday. The stumble bled off some dangerous pressure. Conversely, the market was arguably a tad oversold headed into Wednesday's open, making it easy for renewed hope of trade progress to lift the market in a big way. The shape of the three days' worth of action suggest a short-term bottom has been made, clearing the decks for at least a few bullish days.
The shape and placement of the bars, in fact, bodes very well. Several details are worth tucking away, as current clues, and hints of what to watch for in the future. Two nuances stand out among the rest.
One of them is the shape of Tuesday's bar (circled). The open was near the high, and the closer was even closer to the high, framing a fairly low low for the day... a long-tailed bar that has a hammer shape to it. This hammer formation, as it is sometimes called, is encouraging in that it suggests an intraday shift from a net-selling to a net-buying environment. Wednesday's bullish follow-through on Tuesday's reversal bar underscores the above-average odds of Tuesday's intraday reversal meaning something.
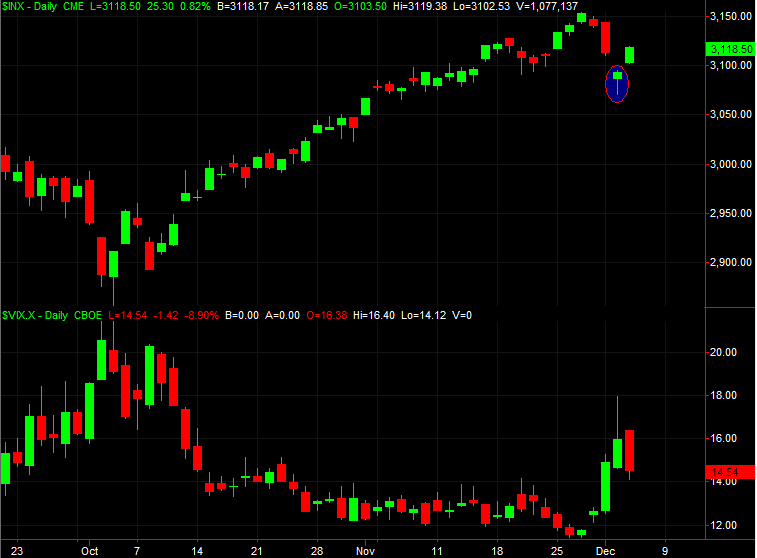
There's another not-so-obvious but crystal clear clue hiding in plain sight with Tuesday's bar though. Its entire high/low range is below Monday's low, and below Wednesday's low. It's completely isolated by gaps, rather than found within a movement path made up of overlapping high/low ranges. This is considered an "island," which often serves as a reversal clue in and of itself. In this instance it hints at blowout, or washout, of selling that cleans up some would-be selling that's been holding the market back, followed by a realization that those sellers made things seem worse than they really were.
One more detail... although not perfect, the VIX at the bottom of the chart is also playing along. Wednesday's open is above Tuesday's close, and Wednesday's close looks like it's going to be below Tuesday's open, reversing what looked to be a budding uptrend for the Volatility Index. These "outside days" suggest the same sweeping change of heart that hammer-shaped islands do for stock-based indices.
To what extent -- or even if -- these clues will pan out is anybody's guess. They may not at all. We're always just one bad headline away from unexpected reversals.
From an odds-making perspective though, this is the kind of setup short-term speculators generally like to see, setting the stage for perhaps a few days of measurable movement.
If nothing else, Tuesday's low from the S&P 500 and Tuesday's high from the VIX serve as a watermark of sorts for the next stumble.