That Sell in May and Go Away Thing? It's Not What You Think It Is.

If you're reading this then you've likely heard the "sell in May and go away" cliche, warning investors that nothing good happens on Wall Street for the next few months. Indeed, things could be altogether bad. And truth be told, there's some actual mathematical evidence to suggest that traders could safely pack it in through mid-September and be none the worse for it.
There are some curious footnotes about the typical trend, however.
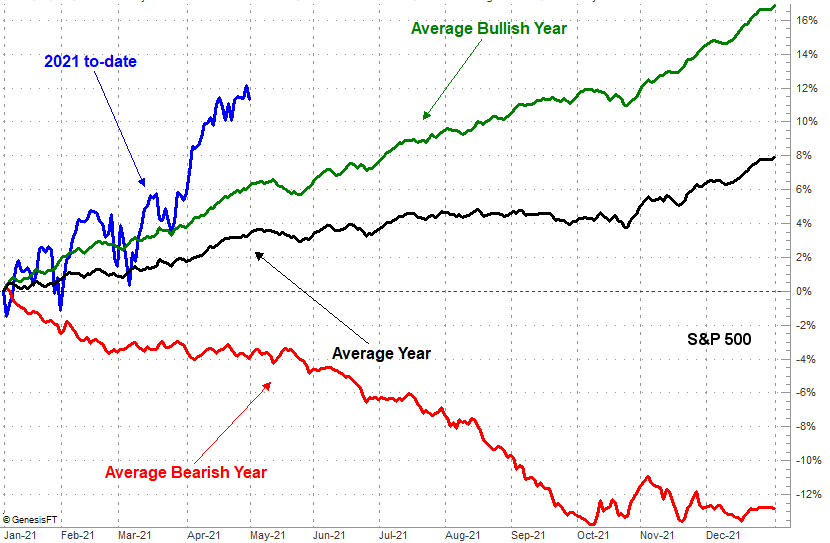
First things first. In the average year, the S&P 500 loses 0.2% if its value in May. That's about as true for bearish years as it is for bullish years, although in bullish years May's lull tends to be little more than a bump in the road. In bearish years it seems to be the point where things go from bad to worse. On balance, there's not a lot to celebrate until October's usual stumble runs its course.
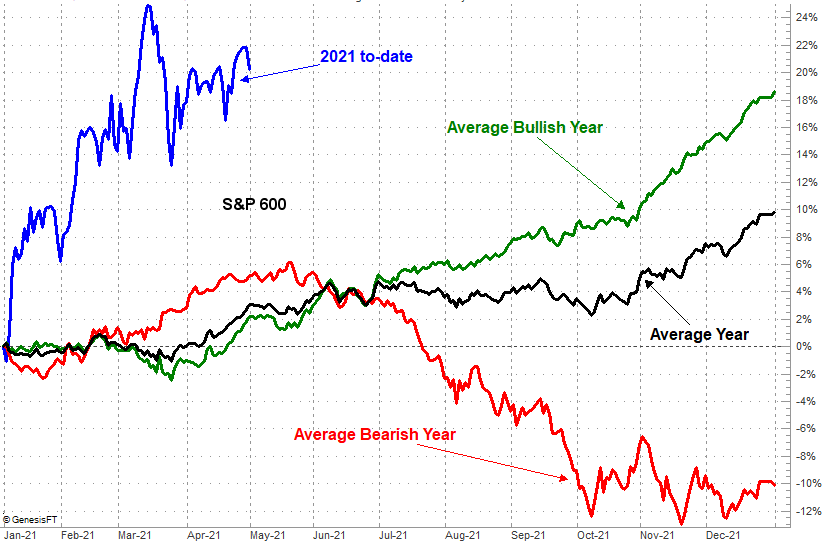
Things are a bit different when you're talking about small caps though. The average May for the S&P 600 Small Cap Index is a 0.8% gain preceded and postceded by bullishness. Ironically, in years that turn out to be bearish for small caps, they tend to start out bullishly with May being the pivot point into strong selling. Fortunately these bearish years are rare; the S&P 600 seems to occasionally benefit from large cap weakness. Unfortunately, the S&P 600 is starting out 2021 unusually bullishly, leaving open the possibility for a major bearish swing back to more normalized paths.
Also note - and this is important right now - that while the average summer and early fall action is mostly flat, in bullish years there's no lull this time of year. Stocks keep on trucking if there's a tailwind, making May's usual turbulence the only month to really worry about.... and that turbulence really only works against large caps.
But what about mid caps? The S&P 400 behaves more like the S&P 600 Small Cap Index and less like the S&P 500 Large Cap Index in May, meaning it gets squirrely en route to a typical 1.0% gain. Then June's usually a volatile, unproductive month. The S&P 400 Mid Cap Index is a bit different than its counterparts though, in that in bearish years it starts out lagging, catches up in May, and then implodes.

Again though, note that in bullish years (years with a bullish tailwind in place), mid caps do fine.
So where then does the whole "sell in May" thing come into play? It doesn't, necessarily. The averages are less than thrilling, but the averages are skewed into mediocrity by a handful of incredibly bearish years. The only thing to really watch out for in May is a bit of volatility. This year's May's biggest risk is just how overbought all stocks are, which could easily cause "sell in May" worries to turn into a self-fulfilling prophecy.