Pfizer Stock Needs a Booster to Clear Resistance on the Chart
-- Pfizer is rallying after its earnings report, but the stock faces resistance. Above and the shares can continue to run. Below? Here's support. --
By Bret Kenwell, TheStreet.com
Pfizer (PFE) shares are higher on Tuesday, up about 3% so far on the day after the health-care stalwart reported earnings.
The outperformance is not that notable on a percentage basis, but it is bullish to see Pfizer shares finally moving higher after a tough couple of months and as the overall market reverses to an intraday loss.
Earnings per share exploded higher by 40% year over year and beat analysts' expectations. Even as revenue fell 6%, the result also beat consensus estimates.
Pfizer, Moderna (MRNA) and others have been struggling this year.
But vaccine stocks have had the wind at their back following reports that Pfizer would roughly quadruple the price of its covid treatment.
Trading Pfizer on Earnings
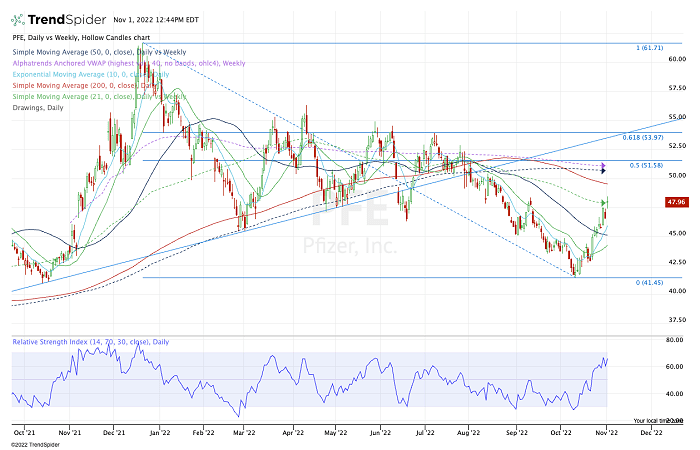
Daily chart of Pfizer stock
Chart courtesy of TrendSpider.com
Pfizer shares have now rallied 16.8% from the October low. Previously, the stock's last two rallies had a maximum gain of 16.5%.
So we have to take that into consideration. The shares are running right into the declining 21-week moving average and fading a bit from this measure.
I don't want to say it's a make-or-break situation for Pfizer, but it's certainly at a notable area for me when considering the information above.
On the plus side, the setup from here is pretty simple.
If Pfizer stock can clear the 21-week moving average, it opens the door to $50 and the 200-day moving average.
Above that and Pfizer faces the 50% retracement near $51.50, with the 50-week moving average and weekly VWAP measure just below. If the stock can power through these levels, then $54 is in play.
On the downside, the bulls want to see Pfizer stock hold $47.50. That was resistance over the past two days and support after this morning's report.
Below that and we'll have to see how active support holds up via the 10-day moving average. It would be healthy to see a test of this level after such a strong run off the lows.
Lastly, $45 is a key area of interest on a larger decline. It's the 50% retracement of the current rally, as well as the 50-day moving average.
To see this area hold as support on a more significant decline would show that the bulls are in control. They could further rest in comfort with a 3.5% dividend yield and trading at less than 10 times earnings.
From TheStreet.com