Monday's Setback Was More Problematic Than It Seems On the Surface
The market's logged plenty of daily losses over the course of the past several months. None of them ever really went anywhere, and certainly none of them have wrecked the rally effort. And, Monday's pullback may not be any different than any of those other stumbles.
There is something different about this one, however, that's worth noting. It could easily be "the one" that finally gets the bearish ball rolling.
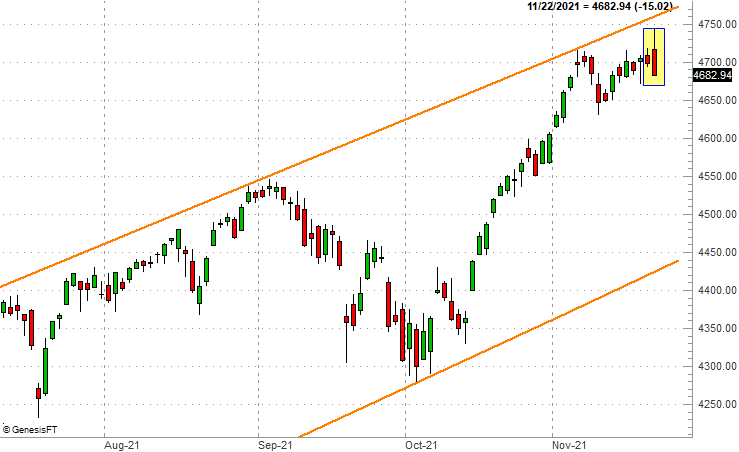
A couple of details lead to that conclusion, not the least of which is the shape of the day's bars themselves. Take the S&P 500, for instance. What started out as a nominal open improved to a respectable gain. When all was said and done though, the index ended up closing below Friday's low. Monday's range between its open and close completely engulfed the previous day's bar... an "outside day" that often indicates a sweeping change of heart.
It's not just the shape of Monday's action, however, that waves a red flag. Where and how it happened is a problem as well.
You'll recall the S&P 500 has been trapped in a trading range for months now, framed by orange lines on out chart above and below. Over the course of the past six weeks we've rallied from the lower of those boundaries to the upper one. The thing is, if the pattern repeats itself, we're now due for a sizeable pullback to the lower edge of this zone again.
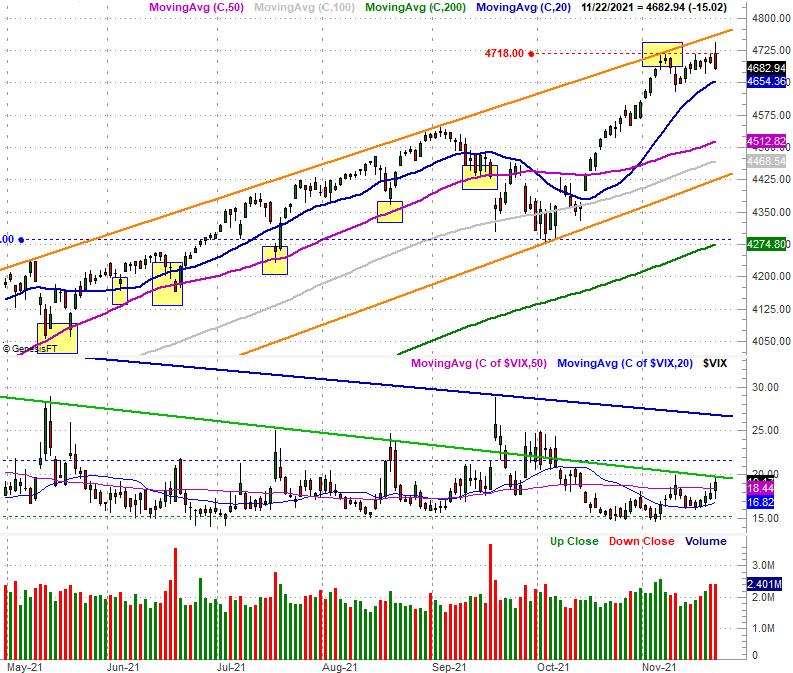
That's not the only thing pointing to a pullback though. As the daily chart below also shows us, the S&P 500's Volatility Index (VIX) is also testing a major technical ceiling of its own. The line that connects most of the key highs [plotted in green] is now being tested as of today's high. The VIX could move above this technical ceiling -- easily -- as early as tomorrow. That won't necessarily mean the broad market is then destined for a massive correction. It does up the odds of that in a big way though.
And the NASDAQ Composite's daily chart looks pretty similar to the S&P 500's. That is, not only did the NASDAQ give us an outside-day reversal, that reversal took shape after the NASDAQ brushed its technical ceiling that connects its key peaks going back to July (orange). This is exactly where you'd expect the bears to make their stand.
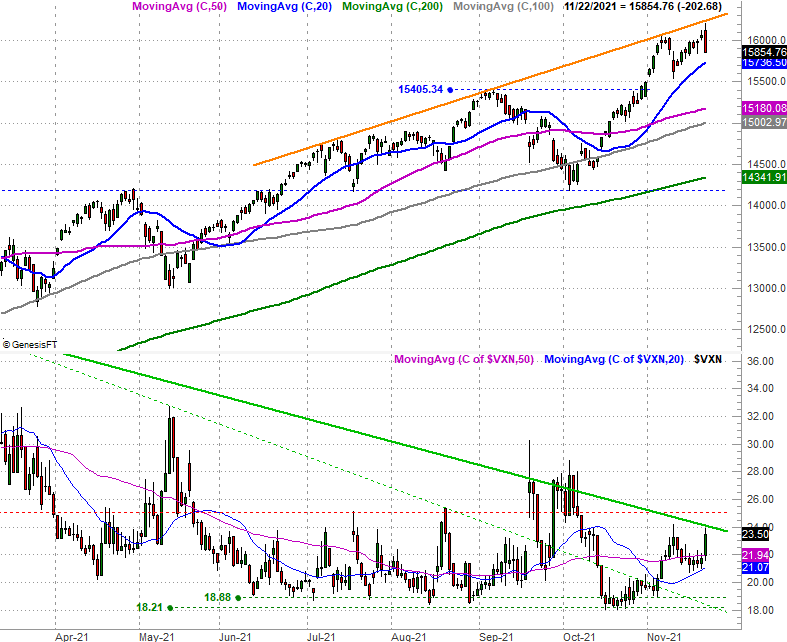
Also notice the NASDAQ's volatility index, the VXN, is on the verge of punching through a major technical ceiling of its own (although you should know that the longer-term and weekly chart of the NASDAQ shows the VXN's key ceiling is much tighter than it seems like it is on the chart above).
Sure, the increase in interest rates and perhaps news that Jerome Powell is getting his second go-around as Chairman of the Federal Reserve seems like it prompted the pullback. That's not necessarily the case though. It's arguable that the headlines are simply the catalyst for a pullback that was going to take shape anyway. Traders were simply waiting for the right reason. It's actually not all that unusual.
Regardless, just keep in mind that while Monday's action is concerning, it's hardly damning. If there's one thing we've seen plenty of this year, it's the market shrugging off short-term weakness to keep on trucking.
On the other hand, sooner or later one of these stumbles is going to go somewhere.