Monday's Modest Losses Were More Damaging Than They Seem on the Surface
With nothing more than a passing glance at Monday's action, it would be easy to brush off the small pullback as just a little bad luck. It happens. Stocks have certainly bounced back from bigger setbacks.
A closer look at several key index charts, however, subtly suggests there may have been more damage done on Monday than there appears to be on the surface.
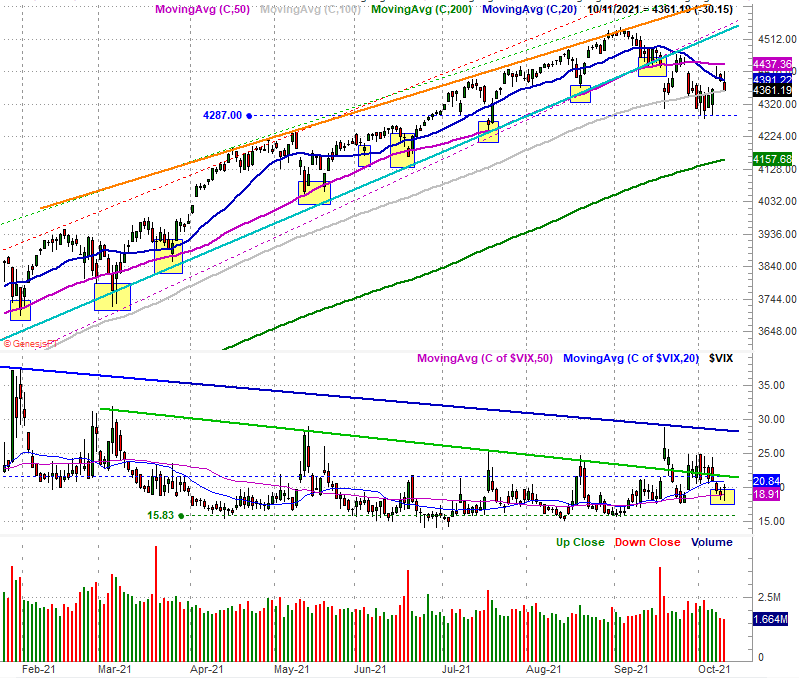
Take the S&P 500 as an example. Things looked good early in the day, but by the time the closing bell rang the large cap index was back below its 20-day moving average line (blue) at 4391, having never moved back above its 50-day moving average line (purple). Also notice the S&P 500's Volatility Index (VIX) appears to be pushing up and off of its 50-day moving average line at 18.91 as part of a recent effort to start logging higher lows and higher highs.
Ditto for the NASDAQ Composite's Volatility Index (VXN), although it's arguably closer to breaking above a major technical resistance line (red) at 27.8... a line that extends back to the middle of last year. It's not over it yet, but that prospect is close. It's made closer by the fact that the NASDAQ Composite pulled back below its 100-day moving average line (gray) at 14,589 for the second time in less than two weeks.
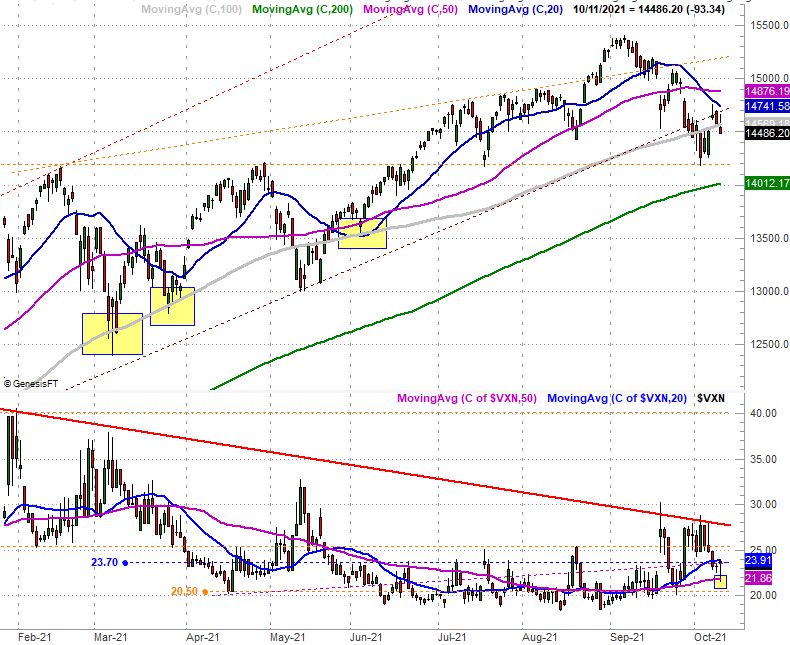
Take note of the fact that there's a major convergence of support developing around 14,200 (red, dashed), where the index found support a couple of times since July, and where the 200-day moving average line (green) will be in the near future. If a move under that floor is in the cards, the VXN is apt to break above its technical ceiling near 27.8 around the same time. That's a huge red flag, if it pans out.
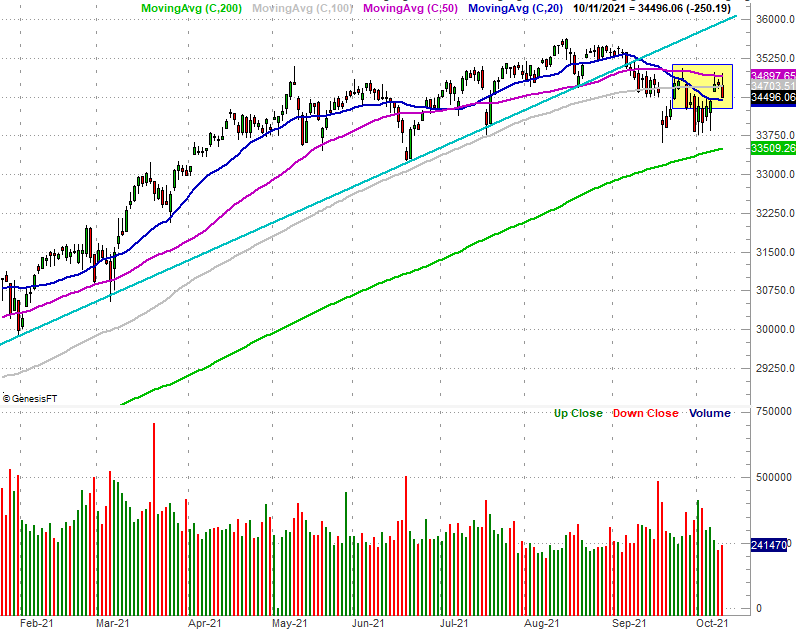
Yes, the Dow Jones Industrial Average confirmed some technical problems too. Namely, it once again found resistance at its 50-day moving average line (purple) at 34.898 to ultimately be sent back below its 100-day line (gray) at 34,703. Indeed, the technical ceiling being made by the 50-day line right now has become downright alarming.
Perhaps the most concerning aspect of Monday's action, however, is something seen from all three of the indices discussed above. All three started out logging a solid gain, kicking off the new trading week on a bullish foot after ending last week with a whimper. The bulls had their chance to get the recovery moving in a big way. They couldn't get it done. It's a bigger-picture hint that confidence in stocks here isn't all that strong at all.
It's not an ironclad bearish call. There are still several ways the market could sidestep slipping into so much trouble that at can't work its way out of it, forcing stocks into a more serious correction. But, it's enough technical trouble to take a look, as all of these hurdles now require up-ending or overcoming this week if the stock market is going to truly recover.
We'll dish out an update if and when it matters.