Monday Sets The Stage For a Bullish Reversal, Though That's All It Does So Far
It remains to be seen if it's been built to last. But, of all the scenarios the bulls could have hoped for on Monday, they one they got was the one they wanted most.
No, the market didn't soar.... at least not on a net basis; today's gain of 0.28% for the S&P 500 will hardly win it any awards. Given that at one point the index was down to the tune of nearly 4% though, the bulls made a strong showing. The question is, can they remain in the bullish mood, and mode.
It's certainly not a foregone conclusion. The S&P 500 was already down 8.7% from its peak as of Friday's close. Today's intraday selloff translates into a 12.3% pullback from the early January peak. That's more than the official 10% standard for a correction, which may have invited a bunch of buyers into the market -- the "buy on the dip" crowd. And, even if the sheer span of the selloff from January's high isn't enticing, the sheer speed of it is. That is to say, this could be a dead-cat bounce. (If anything hits the ground hard enough it'll bounce.) Not all dead-cat bounces actually go anywhere though. It'll take a few days to see if today's dip-buyers are serious.
This is the action, however, the bulls want to see.
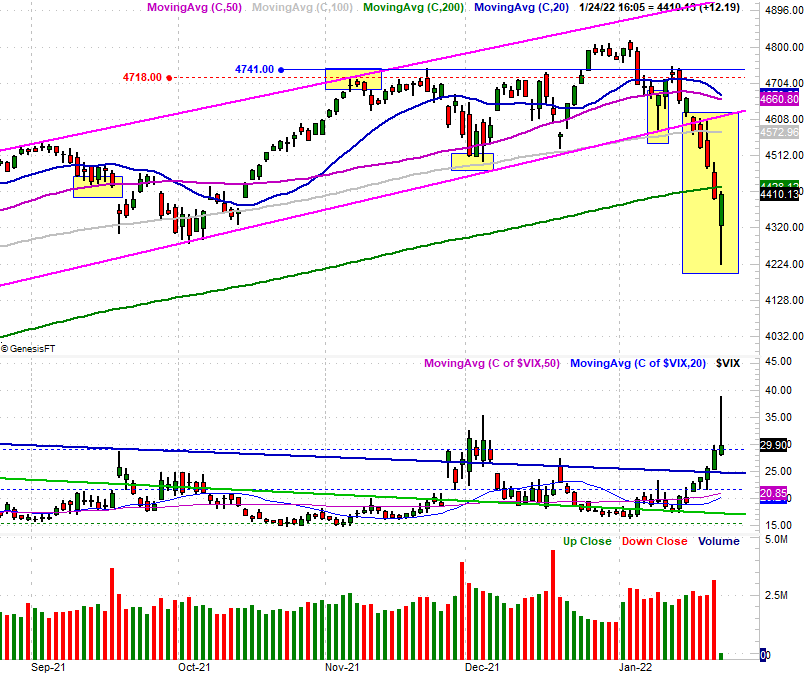
The key is the shape of today's bars. We can use the S&P 500 as an example. After opening in the red at 4327.6 and then proceeding to a multi-week low of 4222.6 before bouncing back to close near the high at 4410.1, investors have run the entire gamut in just a few hours. The sequence of the move, however, is telling. Traders started out in a bearish mood and then turned overwhelmingly bearish by mid-day. But, once bad turned to worse, traders completely changed their minds to end the session on a high note. The shape of the days bar suggests that any would-be sellers that were on the fence were washed out today, leaving behind (and paving the way for) nothing but buyers. The lower the intraday "tail," the bigger and more complete the washout is.
This shape of bar, by the way, is called doji. Monday's action also has elements of what's called a bullish pin, or even a hammer. Don't sweat the names too much, as no single bar is ever a perfect example of these so-called reversal patterns. Just know that the shape of the bar simply starts with a flood of people getting out, and finishes with a flood of people pouring in. Clearly the crowd had a major change of heart in the middle of the day.
The S&P 500's Volatility Index (VIX) gave us the mirror image of this bar too, underscoring the odds that we're due at least a slight reversal effort back into a rally.
We don't know for sure that this will happen, to be clear. As was noted, anything that falls this far and this fast is primed for some sort of bounce. It's possible for stocks to show us a little follow-through on Monday's rebound effort and then peter out a couple of days from now. The S&P 500 would really need to push through that band of resistance between 4573 and 4660 before we can jump to any major bullish conclusions. All the same, we have to put the possibility on our radars.
At the very least we know what to watch for now, just as we know not to jump to any conclusions just yet.