Jack Ma Is Back but Is Alibaba? Let's Look at the Chart
Alibaba shares are hitting one-month highs as founder Jack Ma finally resurfaces. Let's look at the charts to see the trade.
By Bret Kenwell, TheStreet.com
Alibaba (BABA) shares were hitting one-month highs, rising about 5.5% in Wednesday's trading session.
What's driving the rally? Co-founder Jack Ma has made a public appearance in China after being off the radar for several months.
Admittedly, this is a very strange headline to be driving a stock. But the catalysts for the recent decline have been strange too.
The stock was hitting new all-time highs in late October as it neared Singles Day and the holidays. However, shares were quickly cut down on issues with the initial public offering of Ant.
Then there were worries about not seeing Ma for a while, as well as concerns over whether the stock would be delisted from the New York Stock Exchange.
These concerns have been alleviated to some degree and we're seeing the pop in the share price as a result.
Trading Alibaba
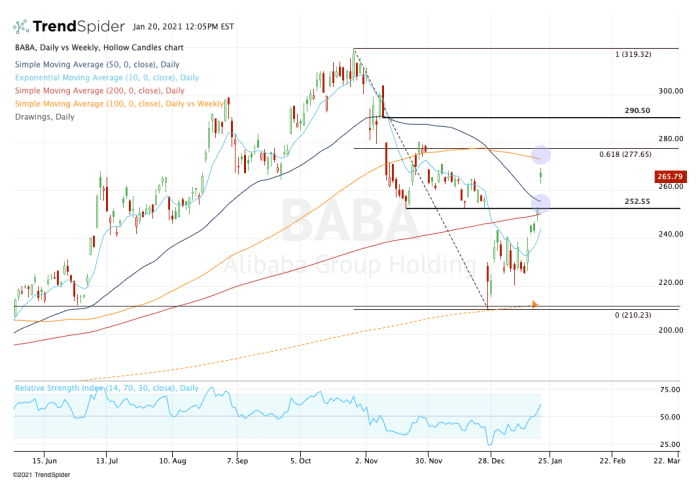
Daily chart of Alibaba stock
Chart courtesy of TrendSpider.com
Look at that painful decline in Alibaba stock as shares tumbled from a high near $320 to a low near $211 in a little under two months.
On the ensuing rebound, shares struggled with the 10-day moving average, which acted as resistance.
Late last week, shares gapped up over this measure, then a few days later reclaimed the 200-day moving average and filled the gap from Dec. 23 near $252.50.
With Wednesday's jolt, shares are now near $265 and in the short term, I'd say it's in a bit of no man's land here.
On the upside, we have the 100-day moving average and 61.8% retracement between $273 and $277.50. On the downside, we have the 50-day and 200-day moving averages between $250 and $255, with that gap level I just mentioned sandwiched in between.
In this respect, I want to see how Alibaba handles whichever area comes first. Should the stock chop sideways, look for it to find potential support at the 10-day moving average, which was resistance on the way down. The hope is that it's now support on the way up.
If Alibaba loses the $250 mark and its key moving averages, look for a potential gap-fill down toward $240.
Above the 61.8% retracement puts $290.50 on the table, which was the start of a nasty decline amid a gap down in early November.
From TheStreet.com