Is the Drop in Caterpillar Stock Done? A Look at the Charts
-- Caterpillar stock had been trading quite well until the last few weeks. Will the technicals support a rebound from here? --
By Bret Kenwell, TheStreet.com
Caterpillar (CAT) hasn't been in the news lately, but its stock sure has moved a lot. Shares have fallen hard over the last two weeks, tumbling more than 15%.
When the company reported its results on Jan. 30, it disappointed investors as shares fell more than 3.5% in response. That set a new bearish tone, as the stock continued to struggle.
While Caterpillar stock did enjoy a nice rally off the February low, the stock was not able to maintain momentum. In fact, these last few weeks have sent the stock to its lowest price since October.
We're seeing a huge wave of selling pressure in cyclical stocks, as investors seemingly worry about the growing odds of a recession. We saw that with travel stocks like Delta Air Lines (DAL) and Royal Caribbean (RCL) last week.
Now trading into an area of support, investors should take another look at the chart of Caterpillar stock.
Caterpillar Stock Into Support?
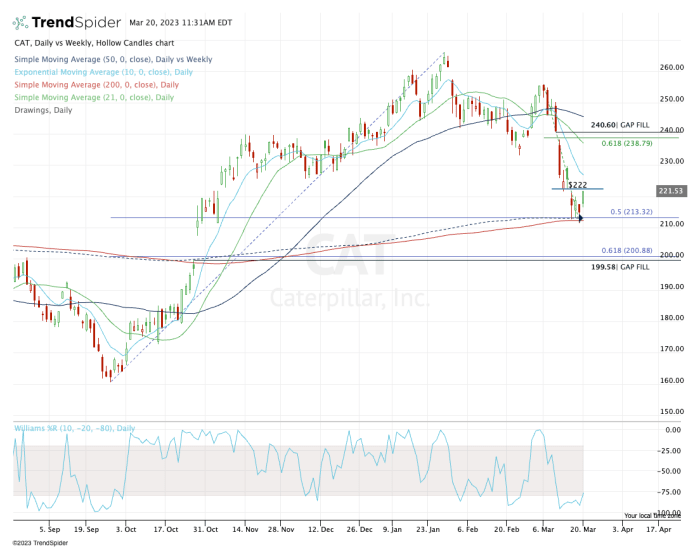
Daily chart of Caterpillar stock
Chart courtesy of TrendSpider.com
Over a three-day span last week, Caterpillar stock hammered out several daily lows in what ended being support near $212.
Where support came into play wasn't random, though.
Instead, it's where the 50-week and 200-day moving averages came into play, as well as the 50% retracement from the 2023 high down to the 2022 low.
Now pushing higher on Monday, bulls want to see if Caterpillar stock can regain the $222 area.
Keep in mind, while the longer-term trends are still intact for the most part, the short-term trends are decidedly bearish. That can create a choppy trading environment when trying a long position, as short-term resistance continues to get in the way.
For Caterpillar, those resistance levels show up at $222 and the declining 10-day moving average, the latter of which is currently near $227.
If shares can push through these levels, the $237 to $240 area could be in play. That's where we find the 21-day moving average, as well as the 61.8% retracement of the current decline and a notable gap-fill level.
As for the downside, keep the $212 area on your radar. A break of this zone thrusts Caterpillar stock below all of the aforementioned support levels above, opening the door down to $200.
Near the $200 mark, the stock will find the 61.8% retracement of the larger range, as well as the $199.58 gap-fill level.
From TheStreet.com