
Recently, the Solar Energy sector has popped up on our watch-list of potential sectors to pay attention to. Over the past few weeks, the Solar Energy sector has been under some pricing pressure and has retraced nearly 50% of the previous trend across the sector. We, the research team at Technical Traders Ltd. understand the Trade War and uncertainty resulting from geopolitical tensions can sometimes create opportunities in the markets for all traders/investors. We just have to be smart enough to find them end execute them efficiently.
Is Solar Energy the next big trend to hit in the Energy sector? What is the potential for these stocks to move 10%, 20% or even 30%+ higher? Let’s take a look.
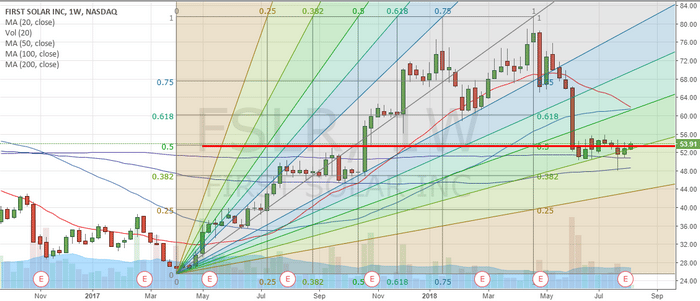
This first chart, a Weekly chart of First Solar (FSLR) presents us with an interesting price setup. After a dramatic price decline in May and June of 2018, the price decline abruptly halted near $52.00. In fact, this downside move ended almost as if prices “legged down” to the last known true support level. Historically, looking all the way back to the lows of 2012, this downside move represents just a little over a 38.2% retracement from the highs and coincides almost perfectly with a 50% retracement from the lows in 2017. These two numbers interest us because they show us that $53.50~55.00 is very likely a strong support level that is currently being tested.
Simple Fibonacci expansion analysis tells us any upside potential could target $61.35 (+12.65%), 69.95 (+28.44%) & 76.20 (+39.99%). These levels don’t take into consideration the potential for new breakout highs above $82.50. If this were to happen, we could see a +50% or more price upside happen.
Before we get too far ahead of ourselves, what would cause the Solar sector to begin a price advance at this stage in the economy? Renewed interest in the new technology of new infrastructure/government contracts? Replacing older technology with newer, higher performance, technology? Renewed interest from personal and corporate clients? What could cause this move?
You may remember that we’ve been suggesting that capital, cash, is always attempting to find solid sources of growth and opportunity while avoiding risk and depreciation. We’ve been suggesting that the spare cash on the planet has been rushing into the US stock markets by the boatload to take advantage of the strong dollar and the strong US stock market values. Could it be time for that capital to shift away from the FANGs and other leaders and move back into opportunistic equities that are somewhat off the radar?
Earnings for these companies for Q3 are set to be announced near October 28, 2018. With FSLR, the Q3 earnings have typically been fairly strong. One could attempt to assume Q3 2018 sales value may surprise the markets again and this could be a good time to consider the Solar Sector as an opportunity.
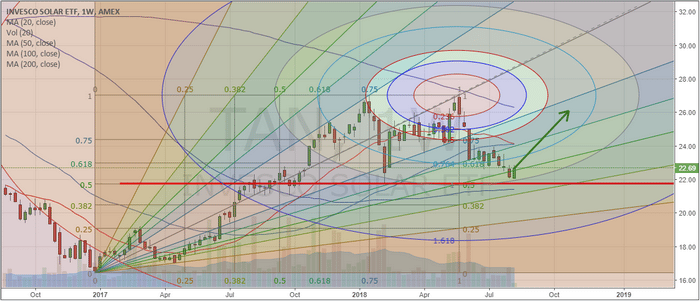
Our next chart is a Weekly ETF chart of INVESCO SOLAR (TAN). This chart presents a similar picture as the previous chart – a relatively strong pullback from April~June of 2018. The price pullback ends near a 50% Fibonacci retracement level and coincides quite nicely with our Tesla Vibrational Price Arc. We’ve drawn an arrow on the chart that suggests where we believe prices could be headed as long at this $21.75 support level holds.
Again, it does not take a genius to understand that any price advance from the $22.70 level to above $26.00 (or higher) would represent an almost +15% move. Any move above $28.00 from current levels would represent a +23.34% move. There is room for profits if our analysis is correct.
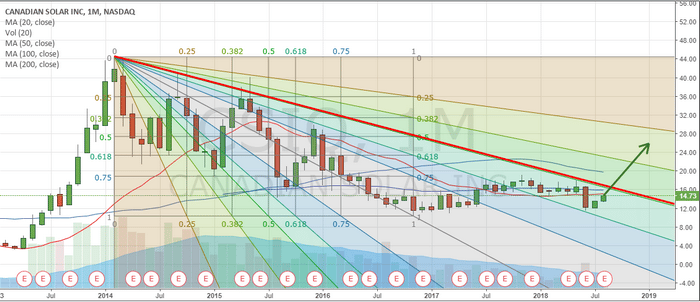
Lastly, we want to highlight what might be the most interesting setup in the Solar sector so far – Canadian Solar Inc (CSIQ). This Monthly chart attempt to show our readers exactly what has been transpiring in the Solar Sector for the past 5+ years. After peaking in early 2014, Solar technology lost its sparkle with investors. Slowly, over time, prices waned and dropped while attempting to find support. Technically, we view that support as the lows established in 2016 (prior to and near the US Presidential elections).
After that point it time, it is pretty clear to see that some renewed interest in the Solar Sector began to take place. Slowly, price advanced from the low as volume stayed somewhat muted. New rotational highs were established while the most recent low is still testing the 2016 lows. This tells us that the price trend, at least until we see a new breakdown low, is attempting to move higher.
CSIQ is currently trading near $14.75 and has upside potential above $21.00 on a breakout move. We are not saying this is definitely going to happen, but we do believe the Solar sector is setting up for an upside move and we do believe the potential for a new rotational high price to be established is quite strong. This means, finding the proper entry point and understanding the downside risk of these trades is critical.
Once CSIQ breaks our Red downward price sloping line, we would assume the price channel has been broken and we would expect the price to begin to rise dramatically.
As a member of our subscription services, you will be alerted to these, and other triggers, as our research team identifies them for the best chances at future success. Please take a minute to visit www.TheTechnicalTraders.com to learn how we can help you find new opportunities in the markets and stay ahead of these trends. Our most recent trade in UDOW returned 12.6% for our members last week. Please take a few minutes to understand how a small, dedicated, team of researchers with 53+ years of experience can make a difference in your future.