Here's Why the NASDAQ's Rally Petered Out... Again
It's becoming an all-too-familiar story. And, though switching the focus from the S&P 500 and the NYSE to the NASDAQ Composite provides us with a little bit of variety, the message is still the same. That is, there's just not enough participation in ANY of the market's recent rally efforts to allow stocks to achieve escape velocity. The only reason the NASDAQ Composite is the guinea pig chosen today to make the point is that the index is also hitting another technical headwind.
The premise is simple enough -- the health of any advance is ultimately determined by how many of the NASDAQ's stocks are making the bullish move, and how much of the exchange's volume is behind the move. On both fronts, the NASDAQ Composite is lacking.
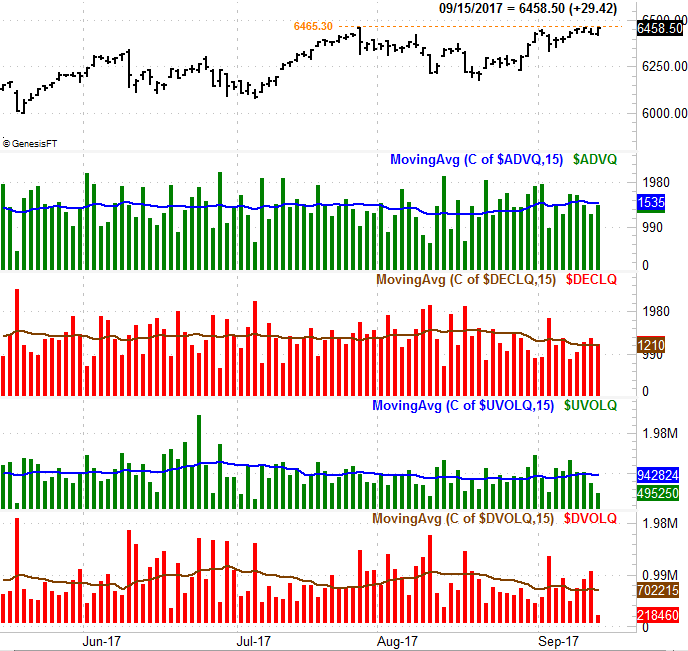
The chart below tells the tale. From top to bottom we see the NASDAQ Composite, the NASDAQ's number of daily advancers , the NASDAQ's daily decliners, the NASDAQ's "up" volume, and then last but not least, the NASDAQ's daily "down" volume. The lines plotted along each data set's bars are a 15-day moving average of all the daily data, to help smooth out erratic measurements and spot a bigger trend.
At first glance it looks like far too many other data charts, with all the day's data seemingly meandering from left to right without much direction. That is, however, the point. It's what you're not seeing anywhere between July and now that you might normally see, were the NASDAQ successfully rallying. Any rallies that last for any meaningful length of time are generally accompanied by a rising -- or at least stable -- number of daily advancers and a growing amount of "up" volume. It started to look like we might finally be seeing both in late August. But, there was no follow-through. While the composite has remained within reach of a breakout thrust this week, the number of daily advancers as well as the degree of daily bullish volume has waned. This rally just doesn't have enough public support, or participation, to last.
That's not to say the tide has turned bearish. The daily decliners for the NASDAQ and the daily "down" volume has been shrinking and subpar of late as well. It doesn't matter though. That's still a recipe for sideways movement.
Whether they're causes or symptoms isn't entirely clear, nor does it entirely matter, but there's also the not-so-small matter of the composite being stuck under technical resistance at 6465, and the fact that September is usually a bearish month for stocks [and this particular September we're especially vulnerable to a pullback thanks to an unprecedented length of time we've now gone without a major correction].
Whatever the case, it's difficult to justify being a strong net-buyer here.... clearly.
For the record, while this type of breadth and depth analysis isn't flawless, it can be powerful; it's particularly helpful because it can wave red flags before it's too late.
The breadth and depth data for the NYSE's stocks appears on the chart of the S&P 500 below. Though you may recall the broad market suffered a big blow in September of that year, a closer, scrutinizing look at the data reveals the NYSE's decliners and its bearish volume started to trend high a few days before the bulk of the meltdown. And, the NYSE's advancers and "up" volume started to trend lower a few days before stocks got hit hard.
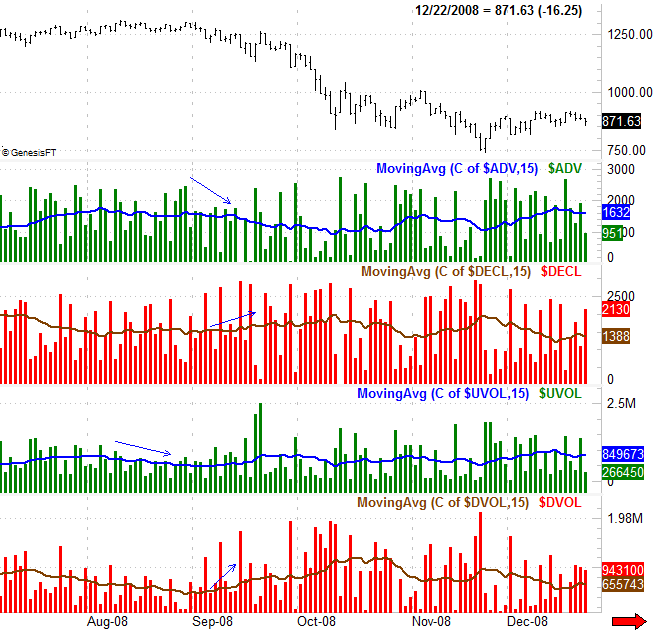
Though the strategy isn't always this preemptive and clear, it is often enough to keep an eye on at all times. It's made even more potent when combined with other kinds of analysis (like factoring in calendar-based tendencies and the fact that the NASDAQ is bumping into proven technical resistance).
Bottom line? Like all the other rally efforts, this one is starting out with an empty tank of gas. We're pretty certain once the next, real rally takes hold, it's going to be marked by growing volume and more participation than this. Unfortunately, it may take a complete capitulation to set the stage for that kind of longer-lived reversal.
The wrench in the works is the calendar. Stocks are supposed to be selling off now to set up a mid-October bottom which in turn sets up the usual year-end rally. We're not following that script this time around though.