Happy Fibonacci Day! Here's What You're Celebrating, and Why.
Happy Fibonacci Day! While it's not a federally recognized holiday, it's something worth noting all the same even if you don't get the day off.
Of course, the $61.8K question many of you are asking now is, what's a Fibonacci?
It's not a what as much as it is a who. It's a reference back to Leonardo Fibonacci -- a mathematician from the Middle Ages who arguably changed the way the world thinks about numbers and numerical patterns forever. Except, he didn't do so with math alone. He did so by observing nature.
But, first things first.
Fibonacci numbers are, in short, some variant of 3/8, and 5/8, although more often than not trades will see these fractions expressed in their more accurate decimal forms of 0.382 and 0.618. (The fraction form using small numbers doesn't yield quite the same, final decimal figures until you reach 144/233, or 89/233. But, these fractions are close enough for now to work with as an example.) The numbers 1.382, 2.618, 3.618, and 4.382 -- and so on -- are also Fibonacci numbers.
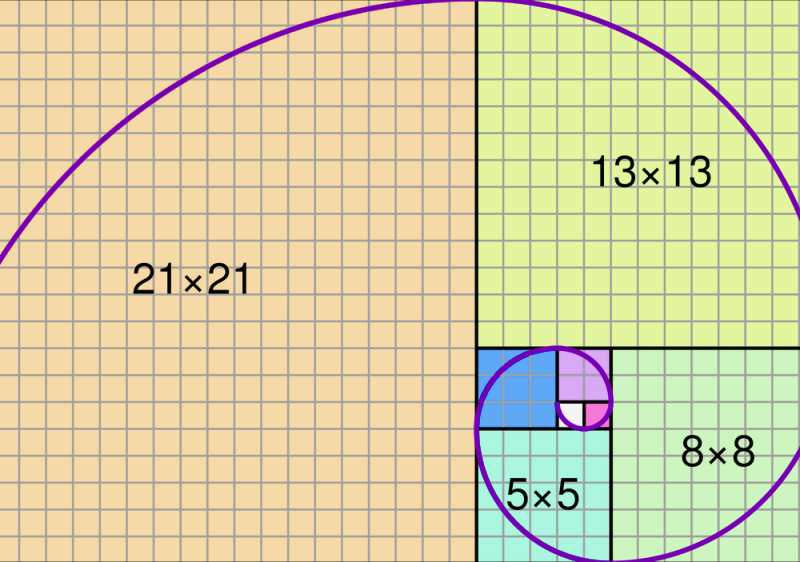
Great, but where do they come from? In simplest terms, Fibonacci numbers reflect the sum of two ever-growing numbers added together, starting with the number 0 and then adding 1 to that figure to lead you to... well, 1 [0 + 1]. Now add that sum of 1 to the 1 that makes up part of the simple math problem. The resulting number is of course 2 [1 + 1]. If you add the latter of the two 1's to that sum 2, you get 3 [2 + 1]. Then, if you add that 3 to the previously-calculated figure of 2, it gives you 5 [3 + 2]. Adding that 5 to the previously-determined sum of 3 gives you 8 [5 + 3]. Adding this 8 to that 5 yields 13 [8 + 5], and so on, and so on.
Repeating this pattern over and over again can produce some very large numbers very quickly. Here's the result of doing this calculation just 23 times: 0, 1, 1, 2, 3, 5, 8, 13, 21, 34, 55, 89, 144, 233, 377, 610, 987, 1597, 2584, 4181, 6765, 10946, 17711, 28657.
What curious, however, is that all of these numbers ultimately reflect a fraction of 3/8 and 5/8, or their corresponding decimal figures.
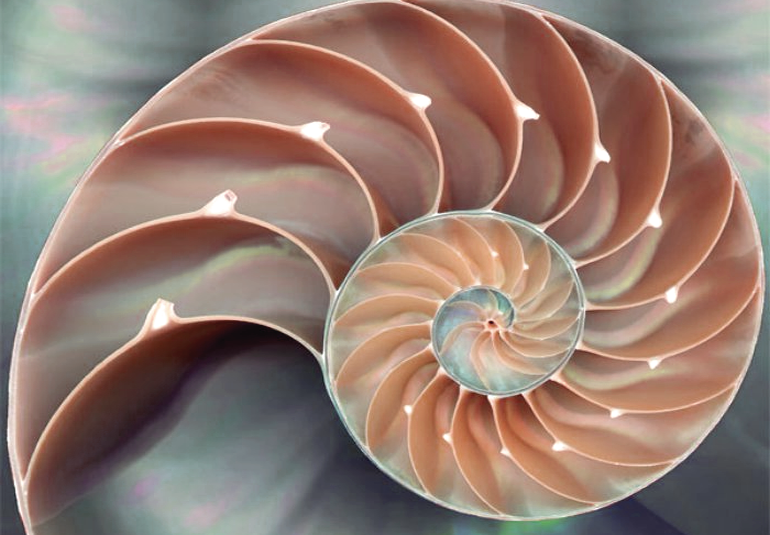
That's not the most curious part of Fibonacci numbers, however. More curious is the fact that these sequences -- or more accurately, their proportions and raw numbers -- are so often reflected in nature. The majority of the world's flowers consistently grow a number of petals that are Fibonacci numbers like 5, 8, and 13. The spiral shape of pinecones isn't quite as random as it seems either. The number of segments or sections is also usually a Fibonacci figure. The dimensions of DNA are Fibonacci numbers. And, you've likely seen this cut-out view of an expanding shell.
Yeah, well, the pace of that growth from its center point also reflects the numbers involved in the Fibonacci sequence.
While interesting, you may be asking yourself what any of this has to do with trading stocks. There's a reason it's worth mentioning here. That is, these same patterns and proportions also often show up on a stock chart.
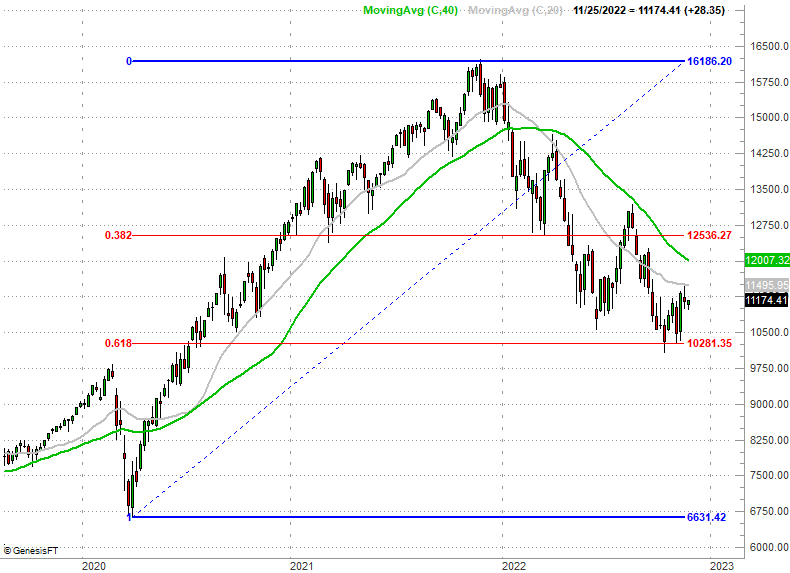
Take the weekly chart of the NASDAQ Composite as an example. The recent low near 10,281? That's a 61.8% Fibonacci retracement of the rally from its early 2020 low to its high reached late last year. It didn't seem like there was any floor there, but when you overlay the Fibonacci lines, the reversal's pivot point makes a lot of sense.
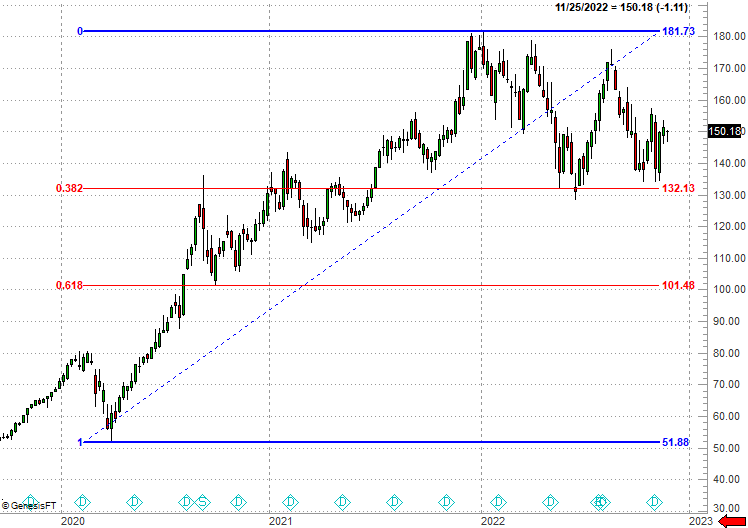
It's not just market indices either. Stocks are subject to the effects of Fibonacci lines as well. While Apple's been a lackluster performer this year, the bulls have drawn a line in the sand around $132. That's a 31.8% (or 3/8) decline from the span of its rally from the low hit at the onset of the COVID-19 pandemic in early 2020.
Surprised that something as simple and silly as this can work so well? What's going on here anyway?
Don't get too stoked just yet. Fibonacci retracement lines as well as Fibonacci extension lines don't always tell you where a stock or index is apt to reverse course; the above examples are somewhat cherry-picked.
Nevertheless, Fibonacci lines often come into play when there's no other technical context on a chart to work with. That is to say, something's better than nothing even of that technical context is only a likelihood rather than a guarantee.
There's still much to be said for adding this trading tool to your toolkit, however, even if you're only looking for approximate, "ballparked" zones in which a stock may reverse course. That's because the nature aspect of Fibonacci numbers also apply to crowd psychology that ultimately determines a stock's price. Even without realizing they're doing it, traders collectively draw "too far" lines in the sand that make for likely pivot points. This makes sense. After all, a stock's price at any given time is the crowd's assumption of its current, risk-adjusted value. People's psyches are subject to the forces that nature's other animals are, ultimately reflecting fear and greed; both turn to panic when the time is right. Like most of nature itself, this is a pretty reliable pattern that people make over and over again. That's why these tools can help you figure out where stocks are likely to travel.
In any case, again, Happy Fibonacci Day! We hope you have a good one, and more than that, we hope you start thinking about Fibonacci lines when you're trading. We've certainly had good luck with them, even if just to gain a better understanding of when charts are reaching an unsustainable extreme.
Oh, and if you're wondering, November 23rd is Fibonacci Day because the four numbers used to denote the date of 11/23 in the common MM/DD format are 1,1,2,3, which are the first four numbers of the Fibonacci sequence.