Gold Starts 2023 With a Bang. Here's the View on the Chart.
-- Gold has been rallying for several months and prices started the year brightly. --
By Bret Kenwell, TheStreet.com
Gold prices have been on a tear lately and the yellow metal is beginning the year with a bang.
The SPDR Gold Trust (GLD) opened higher by 1% and climbed as much as 1.44% on the day before cooling off a bit.
That's certainly outperforming equities, which opened higher on Tuesday but quickly faded into negative territory on the first trading day of 2023.
Gold prices have been trading pretty well, and gold miners have been drawing some attention as well.
Gold futures prices have climbed in four of the past five weeks, with the lone down week a loss of just 0.56%.
The GLD ETF has had a similar run, climbing in four of the past six weeks, with the two down weeks posting losses of just 0.12% and 0.16%.
Lastly, the GLD ETF and gold futures are hitting their highest prices since mid-June and will try for a third straight monthly gain in January.
Is Gold a Good Buy for 2023?
Daily chart of the GLD ETF
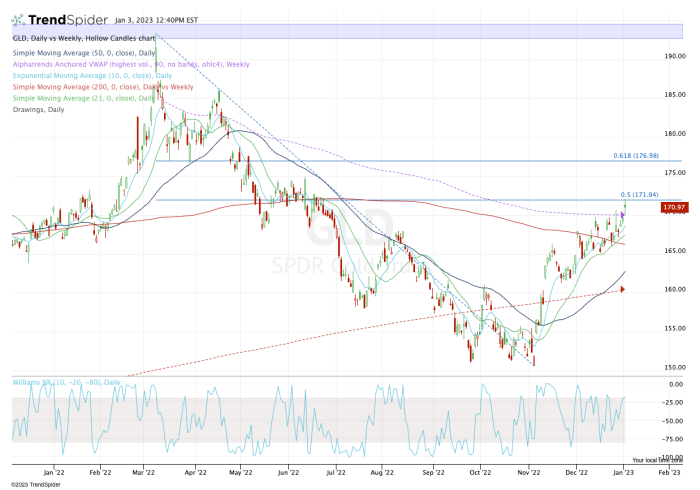
Chart courtesy of TrendSpider.com
Inflation in 2023 is forecast to come down vs. 2022, yet that may not mean the end for the gold trade. That's particularly true if the Federal Reserve does not continue its aggressive rate hikes this year.
That said, the bulls must keep the technicals in mind.
The GLD ETF, pictured above, did a great job of pushing through the 200-day moving average and breaking out over the $170 level and the weekly VWAP measure.
Now that it's running into the 50% retracement, investors clearly are hesitating a bit.
If the GLD can push through the 50% retracement, it opens the door to the $175 to $177 area, which was a key pivot over the past year and which also marks the 61.8% retracement.
If it moves above all these levels, the gap-fill near $179.75 is in play. Above $180 and the talk about new 52-week highs will begin circulating.
On the downside, the bulls want to continue to see active support via the 21-day moving average.
While support at the 10-day would indicate a stronger trend, the 21-day has been key support for the GLD lately.
The longer the GLD can stay above $170, the more bullish it becomes. On the downside, a break of the 200-day moving average could suggest some caution ahead.
From TheStreet.com