Friday Is a Make-or-Break Moment For the Market

Stocks dished out a less-than-thrilling performance on Wednesday. But, Wednesday's rally was so strong that Thursday's lethargy doesn't really matter. Most of the major indices are already up and over key technical hurdles; one more good "umph" on Friday could seal the deal for this budding rally.
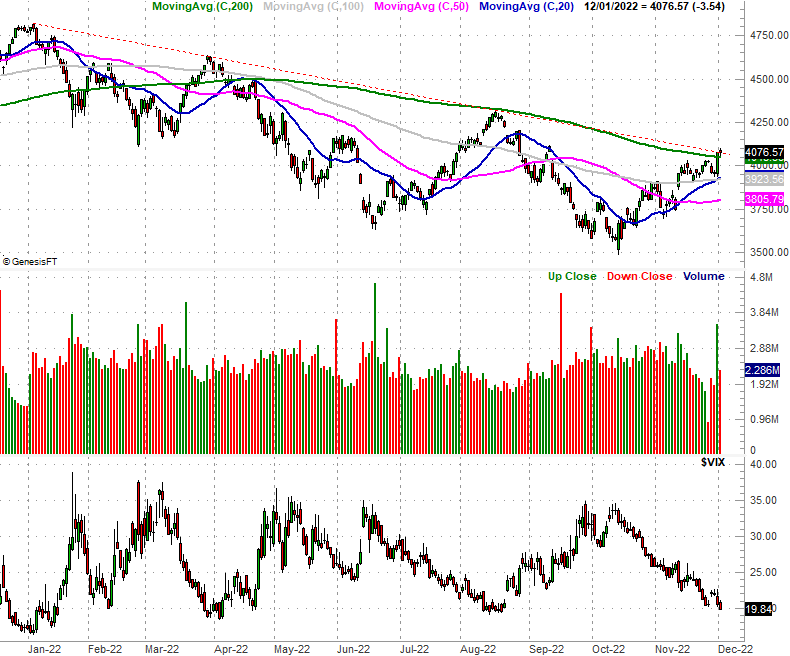
Take the daily chart of the S&P 500 as an example. While it's tough to see it in detail from this distance vantage point (we'll zoom in here in a moment), the line that connects all the key highs going back to January's peak (red, dashed) is failing as a ceiling. The index is also now above its pivotal 200-day moving average line (green) at 4048.
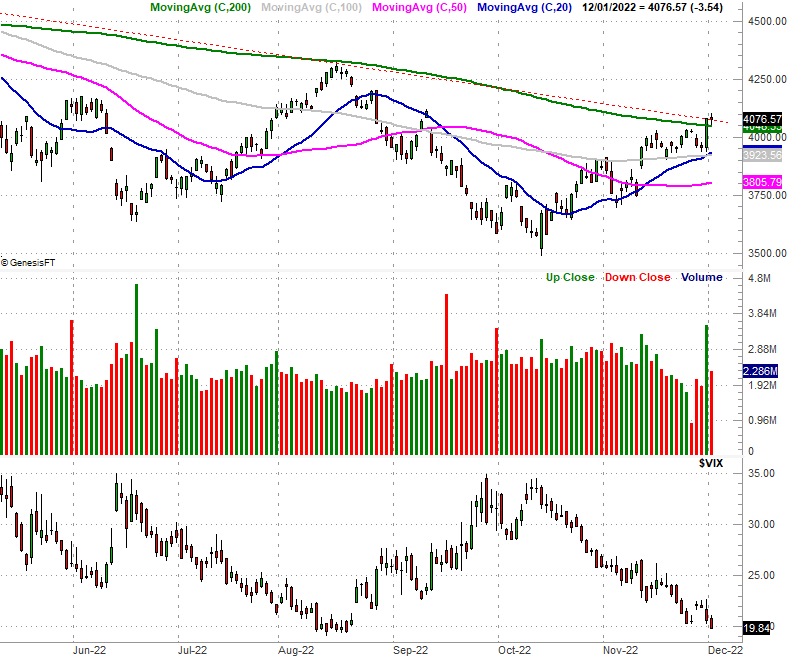
Here's the close-up view of the same chart. As you can see the index is now above key resistance levels, albeit just barely. The bulls would prefer a bit more clearance before getting excited. Nevertheless, it almost looks as if the 200-day moving average line could be serving as a pushoff point from here; that's where Thursday's low was.
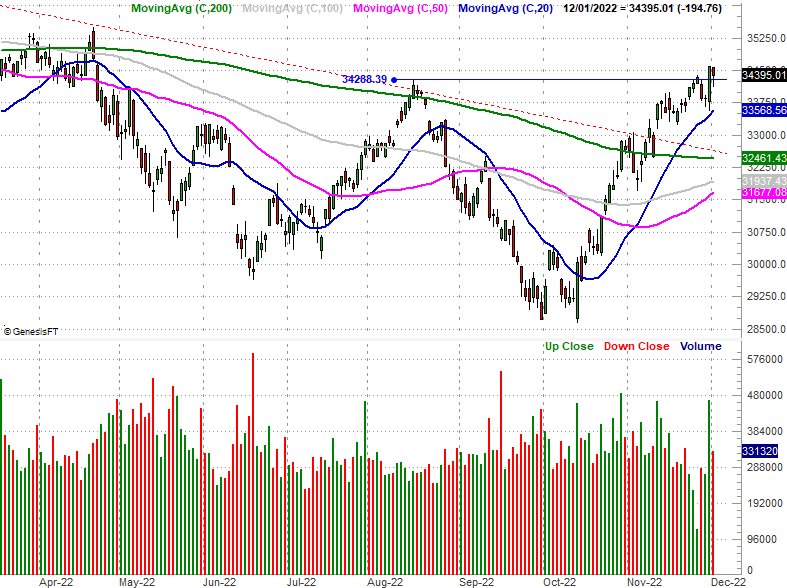
The Dow's contributing to the effort. Thanks to Wednesday's pop the blue chip index was finally able to decidedly clear a resistance level near 34,288; even Thursday's weakness wasn't enough to drag it back below that level.
The only index that isn't playing along yet is the NASDAQ Composite, although it's the one we're going to be keeping the closest eye on from here simply because if it pushes higher on Friday, it could fully tip the scales in a bullish direction.
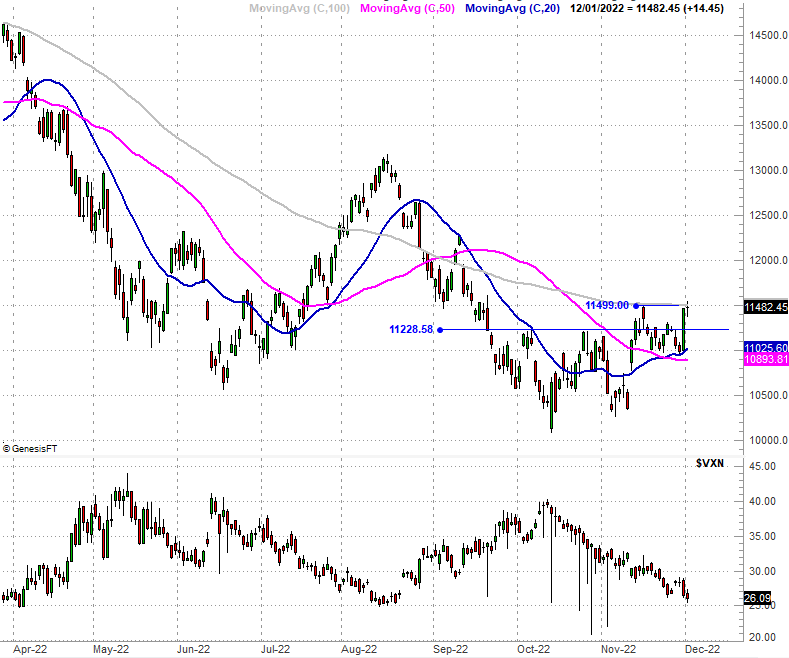
Take a look. Pushing up and off of the 20-day moving average (blue) at 11,025 on Wednesday, the composite was able to test the 100-day moving average line (gray) as a ceiling on Thursday, at 11,500. That's also where the NASDAQ peaked in mid-November. It didn't clear either of the now-converging resistance levels. But, it's knocking on the door of both. If it can make decent forward progress on Friday -- and if the other indices do the same -- it may well be enough to get the market moving at full speed to make for the usual year-end rally.
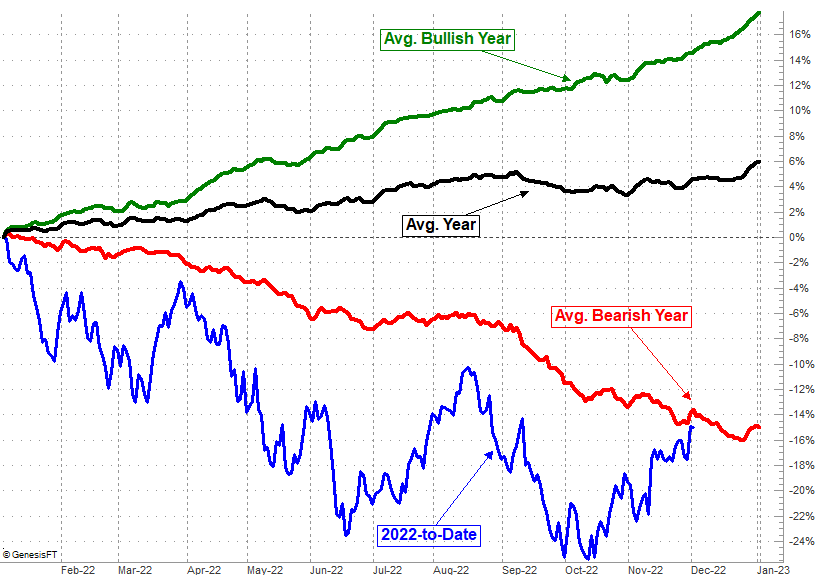
In this vein, this is how things would normally shape up to end the year, and where the S&P 500 is thus far in 2022. Down 15.1%, it's not just well below the overall average -- it's even a bit below the average bearish year. Although bearish years tend to end the year on a low note, statistically speaking, the odds favor a bullish December.
This of course poses a difficult question: Is this year more apt to finish the year like the typical bearish year and log a loss for December? Or, will the market defy the (slight) odds here and make bullish progress this month despite this year not being the typical bullish one we see leading into a strong, bullish close for the year? It could go either way; stocks may well make a run for a strong finish despite the poor start. We just don't know. We're certainly not ruling such a prospect out anyway, especially given how close all the indices are to making a major breakout move on Friday.