First Solar Stock Hits 52-Week Highs. Here's the Trade

-- Solar stocks are energy stocks, too, and this group has been on fire. Here's the trade on First Solar. --
By Bret Kenwell, TheStreet.com
First Solar (FSLR) is leading the charge for solar stocks, hitting 52-week highs on the day.
Think about that for a minute. While the overall market has reversed hard and is now down notably on the day - and is a far cry from its high - First Solar just hit one-year highs.
The momentum in this group is not new, either.
Including this week, First Solar stock is now up in six of the past seven weeks. Although the same cannot be said for the Invesco Solar ETF (TAN) or Enphase Energy (ENPH), solar stocks in general have been strong performers.
On Aug. 1, we noted the bullish trends within the space. Part of that was because of earnings from Enphase (ENPH) (and later First Solar). The federal government was another positive catalyst.
Helping spark today's move is a Wall Street Journal report that First Solar will look to boost its U.S. manufacturing capacity now that there's more clarity from the government and following the Inflation Reduction Act.
Trading First Solar Stock
Daily chart of First Solar stock
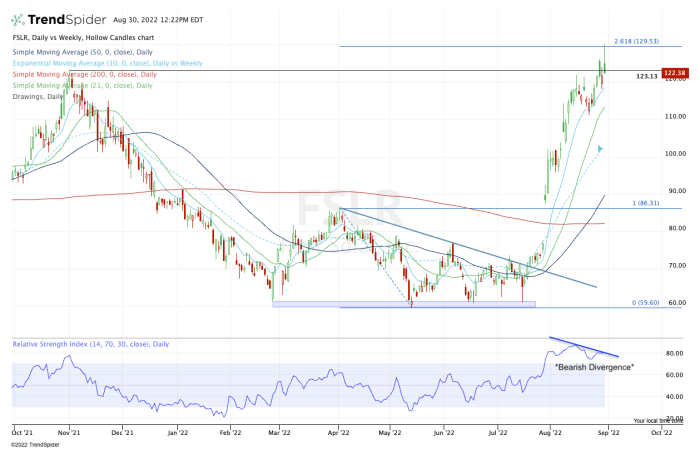
Chart courtesy of TrendSpider.com
First Solar stock has been incredibly strong, but take note of a couple of things on the chart.
While the stock hit 52-week highs today, the RSI measure did not hit new highs. Instead, there was some bearish divergence on this reading.
Second, the stock continues to struggle with closing over the 2021 high at $123.13. It may still do so today, but it's clear that it's been a struggle.
Lastly, it hit the 261.8% extension from the May low to the previous 2022 high. That's a pretty good upside target for short- and intermediate-term investors.
After reading that, you may be inclined to think First Solar's setup is bearish, but it's not! This chart is incredibly healthy, even if it has a few cautions to take note of.
Longer term investors may rather wait for a potential dip down to the $100 area and/or the 10-week moving average before getting long. That's fine. With the shares remaining above the 10-day and 21-day moving averages, though, the short-term trend remains bullish.
As for the upside, let's turn to the monthly chart to get a better idea of where First Solar stock has been and where it can go from here.
Monthly chart of First Solar stock
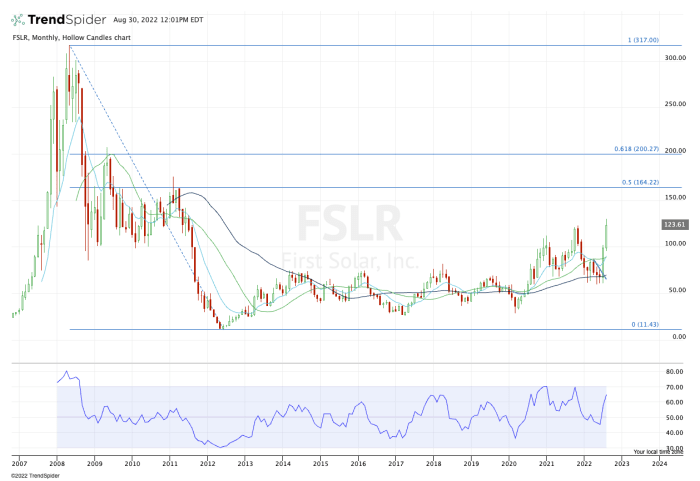
Chart courtesy of TrendSpider.com
On the upside, the bulls need to see a close above $123.13, then above $130. That opens the door to $150, then the 50% retracement on the long-term chart up near $165.
Above that eventually opens up $200 as a possible landing spot. Not only is this level psychologically relevant, but it's also the 61.8% retracement of the long-term chart.
When investors think of the leading sector - energy - it seems like they think of oil and gas. Well, it's time they start thinking about other solar stocks as well, as First Solar is proving today.
From TheStreet.com