Can Nasdaq, S&P 500 Still Hit New All-Time Highs in 2021?
-- The stock market is technically in one of its most bullish periods of the year, but after Friday's pullback, investors are worried. Here's how to proceed. --
By Bret Kenwell, TheStreet.com
There were some caution flags coming out as we entered the holiday-shortened trading week.
The major indices - particularly the Nasdaq - had bearish divergence on the charts, while market breadth was not that impressive.
Admittedly, the market was making new highs, but the action below the surface was not that good.
Simple sector rotation was propping the market up, while some of the big names like Apple (AAPL) did the heavy lifting.
Overnight traders saw the Dow futures down more than 1,000 points at one point, while the S&P 500 futures were down about 140 points or close to 3%.
With Monday's strong bounce underway, where does the market stand now?
Trading the S&P 500
Daily chart of the SPY ETF
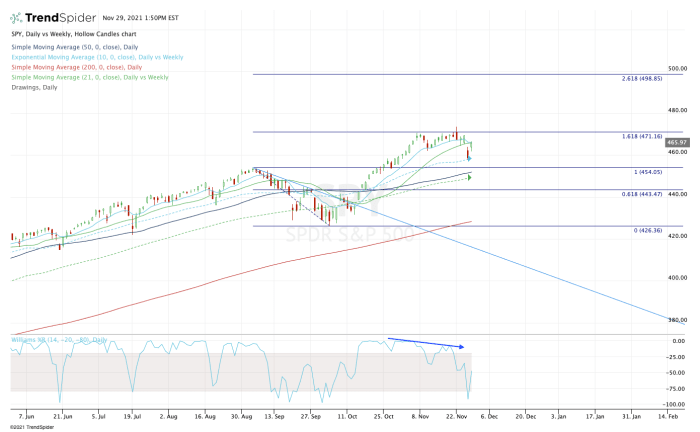
Chart courtesy of TrendSpider.com
The chart above looks busy, but it's actually quite simple.
Looking at the SPDR S&P 500 ETF Trust (SPY), we can see that it was trending below all of its major moving averages, but struggling with the 161.8% extension at $471.16, as well as the $470 to $471 area - that's 4,700 on the S&P 500 futures.
On Monday Nov. 22, the SPY tried to rotate higher and for a moment, it did. It hit new all-time highs on the day, as did the Nasdaq.
That move came as Jerome Powell was renominated as Fed chairman. However, the gains quickly reversed, causing some instability in the market.
While the SPY held its short-term moving averages, the poor breadth, sell-the-rallies reactions and bearish divergence (highlighted on the bottom of the chart) were taking a toll.
Then we gapped lower on Friday and traded near the lows at the close.
Traders not using multiple timeframes likely missed that we traded down into the 10-week moving average.
Now pressing higher on Monday, bulls are feeling good. However, it's vital that the SPY reclaims the 10-day and 21-day moving averages.
If the bulls can get a daily-up rotation on Tuesday - meaning the SPY clears Monday's high - they may very well be back in control moving forward, putting $470 to $471 and higher back on the table.
If the SPY can't reclaim the 10-day and 21-day moving averages, last week's low remains vulnerable.
Below that puts the $450 to $454 area in play, along with the 50-day moving average.
Trading the Nasdaq
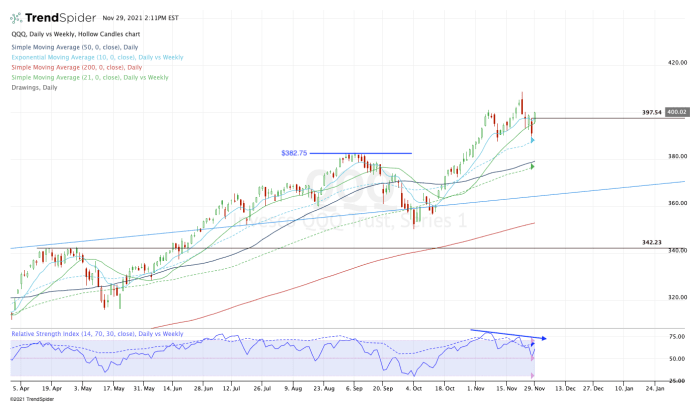
Daily chart of the QQQ ETF
Chart courtesy of TrendSpider.com
Glancing over to the Invesco QQQ Trust (QQQ) - Get Invesco QQQ Trust Report chart, traders see a similar situation.
In this case, the bearish divergence was more pronounced, while the QQQ was in a stronger trend than the SPY ETF.
The QQQ didn't quite test its 10-week moving average on the dip. However, once it went daily-up over Friday's high at $397.54, it put $400-plus back in play.
Now above all of its daily moving averages, bulls are in control and it's up to them to keep the Nasdaq moving higher into year-end.
If the bears jam the QQQ back below the 21-day moving average, it could revisit last week's low and the 10-week moving average. Below that puts the prior breakout level in play near $382.75, followed by the 50-day moving average.
From TheStreet.com