Can AMD Go on a Rally Like Nvidia and Hit All-Time Highs?
-- AMD is breaking out to multi-month highs and clearing range resistance. Can it go on a run like Nvidia has over the last few months? --
By Bret Kenwell, TheStreet.com
First it was Nvidia (NVDA) that enjoyed the big gains. It it now Advanced Micro Devices' (AMD) turn?
Shares have risen about 3.5% on Tuesday as the stock is hitting its highest levels since February.
The stock was flirting with a move over range resistance on Monday, but is really pushing higher on Tuesday. The rally comes on positive reports regarding U.K. regulators and AMD's acquisition of Xilinx (XLNX).
For its part, Xilinx shares are also hitting the highest levels since February.
Nvidia and the VanEck Semiconductor ETF (SMH) both hit new highs this week. With AMD stock continuing to consolidate and now making progress on its $35 billion acquisition, can it too break out to new highs?
Let's look at the chart.
Trading AMD
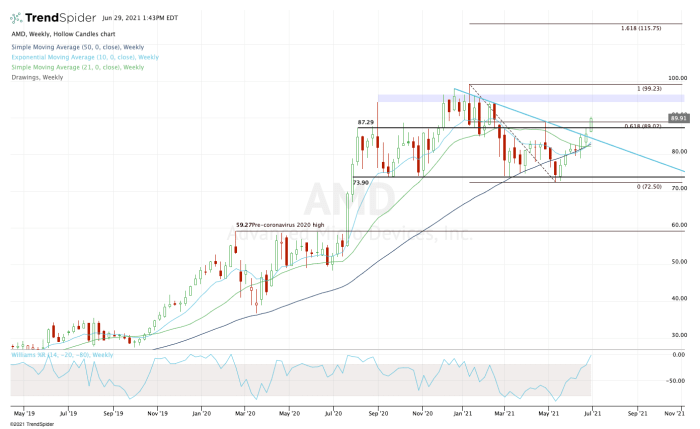
Weekly chart of AMD stock
Chart courtesy of TrendSpider.com
In July 2020, AMD stock exploded over $60 resistance, quickly climbing to a high of $87.29 in just a couple of weeks.
After that, the stock settled down, bouncing between $74 and $88. Eventually, AMD broke out to a new range, with $88 acting as support instead of resistance, and the $94 to $96 area acting as resistance.
Interestingly, support eventually gave way and AMD fell back into prior trading range.
As I mentioned in the opening part of the story, AMD is breaking out over $87 to $88 range resistance again as the stock is pushing to multi-month highs. It's also pushing through the 61.8% retracement.
From here, bulls are looking for the $87 to $88 area to again turn from resistance into support. If that happens, the $94 to $96 area is certainly within reach.
If AMD can push through that zone, look for a test of the all-time high at $99.13 and then $100 above that.
Should shares really get moving - like Nvidia did - then the $115 level could be in play near the 161.8% extension.
On the downside, a move back below $87 needs to be met by support from the 50-day moving average. Otherwise, $80 could be on the table.
From TheStreet.com