Buying the Dip in Cisco? Check the Charts First
-- Cisco Systems stock is in the midst of a correction. Here's where support should come into play --
By Bret Kenwell, TheStreet.com
After a strong run, Cisco Systems (CSCO) stock has been cooling off lately.
At one point, shares were up 3% on Wednesday, then flipped to a decline of 1.4%, before settling lower by 0.54%.
The stock got off to another strong start on Thursday, rallying almost 2% in premarket trading because the "network equipment maker told investors it expected to see greater revenue from software and subscriptions than its traditional core business."
Of course, an upgrade from Credit Suisse helped, with analysts assigning a $75 price target on the stock. JPMorgan analysts also added the stock to their "Focus List."
It's not helping too much, though.
Now down in eight of the last nine sessions and working on its second down week in a row, bulls are wondering if Cisco can soon find its footing. That's especially after it rallied in seven straight weeks before the current correction.
Let's look at the charts.
Trading Cisco Stock
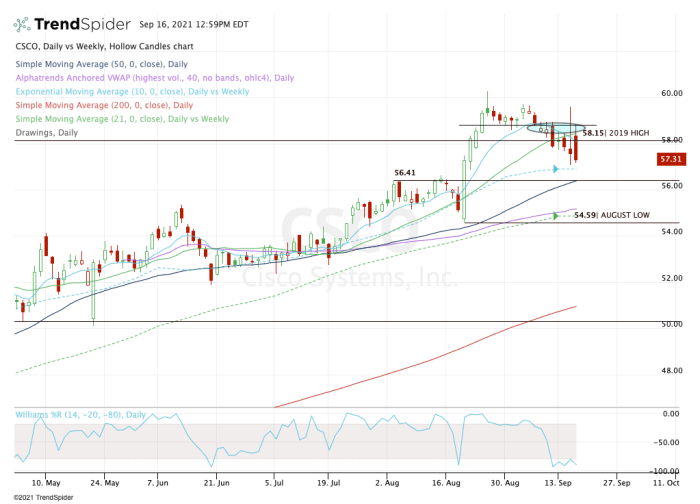
Daily chart of Cisco stock
Chart courtesy of TrendSpider.com
In 2019, Cisco stock pushed higher and topped out just above $58 before undergoing a multi-year correction. Otherwise, this level wouldn't seem very important.
Earlier in the month, the $58.50 level was acting as support, along with the 10-day moving average. Then both of these measures began acting as resistance, signaling a change in tune for the stock.
In other words, it was going from bullish to bearish.
Then Cisco lost the $58 level and the 21-day moving average, which like other prior key measures, began to act as resistance as well.
However, the longer-term trend remains bullish, even though the share price has been wavering in the short term. It also leaves us with a pretty clear roadmap.
On the upside, Cisco stock needs to reclaim the 10-day and 21-day moving averages, and eventually clear the $58 to $58.50 area. That opens the door for a push back to $60 and higher.
On the downside, keep a close eye on the 10-week moving average. Just below that mark is the $56.50 breakout level and the 50-day moving average. Given the run, I would expect this area to act as support should Cisco stock test down this far.
On a larger flush down, look for support from the 21-week moving average, VWAP measure and the August low near $54.50.
From TheStreet.com