-- Wynn Resorts stock is teetering on a breakout that could send it back to the year-to-date high (and possibly much higher). --
By Bret Kenwell, The Street.com
Wynn Resorts (WYNN) started off the year with a bang, the shares exploding to the upside.
The casino company's shares rallied in six of the first eight weeks of 2023. The two down weeks were losses of less than 1% and one of those was a mere 0.03%.
After the stock more than doubled (up 116%) from the October low to the March high, it's been consolidating.
It's worth mentioning that other travel stocks were doing well, too, in the beginning of the year. Specifically, casino stocks like MGM Resorts (MGM) and Las Vegas Sands (LVS) did well. These stocks posted rallies of 83% and 64%, respectively.
Wynn Resorts enjoyed a yet larger rally than both these names, and when we look at the chart, traders will notice how well it held up on the pullback.
Trading Wynn Stock
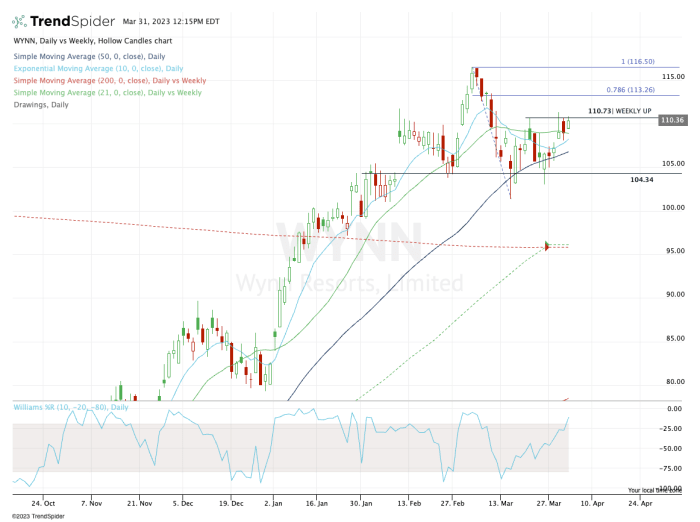
Daily chart of Wynn Resorts stock
Wynn stock enjoyed a robust upside rally that ultimately sent shares into a breakout over the $104 to $105 area. This area then held as support before the stock powered up to $116.50 in early March.
The pullbacks were a little sloppy, as Wynn saw wide trading ranges and fluctuated sharply around the 50-day and 10-week moving averages.
Notice this, though: Despite breaking below one or both of these measures in six out of 10 sessions (and coming within pennies of them in two other sessions), Wynn stock closed above the 50-day and 10-week moving averages every time.
Now the shares are trying to rotate over last week's high of $110.73. If they can do so on Friday, March 31, all the better.
If not, that's okay. The bulls will be keeping a close eye on the $110 to $111 area all next week, as the same setup will be present over the current week's high.
If Wynn stock can clear this zone, $113.25 could be in play next, followed by the $116 to $117 zone. Above that and new 2023 highs are on tap - potentially up to $125.
On the downside, keep a close eye on the 10-week and 50-day moving average. A daily close below these marks could open the door back down to the former $104 to $105 breakout area, followed by a possible test of the 21-week and 200-week moving averages currently near $96.
From TheStreet.com