American Air and Southwest Air Earnings: A Tale of Two Charts

-- American Airlines and Southwest Airlines both reported earnings this morning. One chart is great for the longs and one is bearish. Let's take a closer look. --
By Bret Kenwell, TheStreet.com
It's been mostly good news in the airline industry over the past few weeks. Not only have the stocks been trading quite well, but the earnings have been relatively strong as well.
Delta Air Lines (DAL) and United Airlines (UAL) reported earnings last week. This week we heard from American Airlines (AAL) and Southwest Airlines (LUV).
As one might expect, for AAL and LUV it was the tale of two outcomes.
Coming into earnings season, we had noted American Airlines as being the strongest of the major airline companies.
On the flip side, Southwest Air has been the worst performer, plagued by thousands of canceled flights in December. While a storm wreaked havoc on the airline space near the holidays, Southwest had an embarrassing and prolonged fallout from the event.
Let's take a closer look at the stocks, starting with the strongest.
Trading American Airlines Stock on Earnings
Daily chart of American Airlines stock
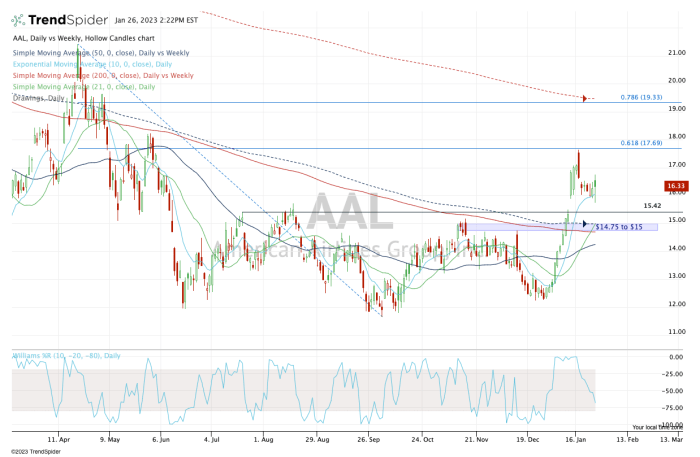
Chart courtesy of TrendSpider.com
Given how well American Airlines stock was trading before its earnings report, it's no surprise to see it trading higher after the report, albeit only slightly.
The company reported solid fourth-quarter results, but it was the guidance that really blew away consensus expectations. Management expects adjusted earnings of $2.50 to $3.50 a share vs. analysts' expectations of $1.79 a share.
At the midpoint, that leaves the shares trading at just 5.33 times earnings.
American Airlines stock continues to hold above the 10-day moving average - also known as active support. That leaves the recent high and the 61.8% retracement in play near $17.50.
A close above that level opens the door to the 78.6% retracement and 200-week moving average near $19.25.
On the downside, a break of today's low (at $15.73) puts the $15.50 level in play, followed by a much larger support zone between $14.75 and $15.
Trading Southwest Airlines Stock on Earnings
Daily chart of Southwest Airlines stock
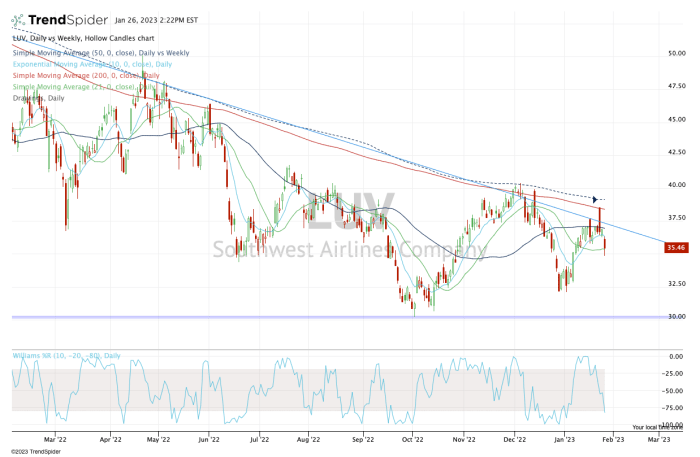
Chart courtesy of TrendSpider.com
Conversely, Southwest Airlines stock is moving lower after its disappointing results and poor outlook due to the cancellation chaos it went through last month.
As we look at the chart, it's a pretty straightforward approach as the stock continues to make lower highs and is being rejected by the 50-week and 200-day moving averages.
From here, keep an eye on $35. If Southwest stock takes out that level, it opens the door back down to the $32 to $32.50 zone. Below that and the 52-week low near $30 could be on the table.
From TheStreet.com