- Amazon has come off its highs, but is trading down into support while high-growth tech gets hit harder. Let's look at the chart -
By Bret Kenwell, TheStreet.com
The latest bout of the tech selloff has been hitting stocks differently. Amazon (AMZN) hasn't been hit too hard, at least compared with growth stocks.
Unlike past selloffs in tech, FAANG names are largely dodging the dip.
That's not to say Amazon, Microsoft (MSFT), Alphabet (GOOGL) and others aren't seeing declines - they are - but the losses are minimal compared with others.
While Amazon is down 12% from its 2021 highs, Alphabet and Microsoft are down just 3% and 7%, respectively. This compares to an 11% dip from the highs for the Nasdaq.
By and large, the FAANG group has been trading sideways for several quarters now. With the selloff strengthening, high-growth is being punished, while "value" plays are sidestepping most of the carnage.
Trading Amazon
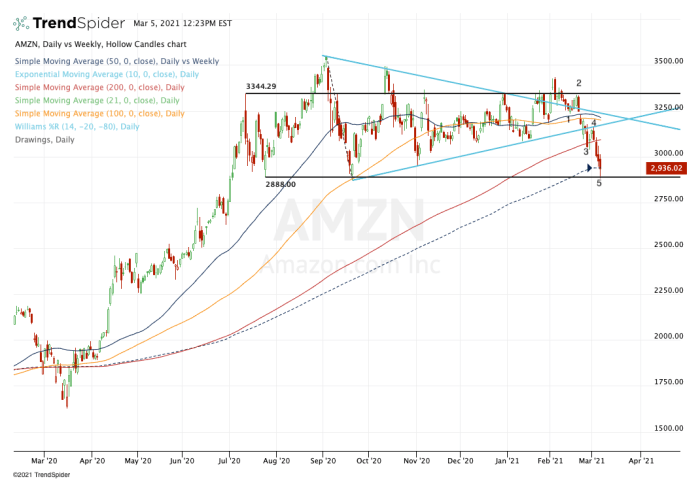
Daily chart of Amazon stock
Chart courtesy of TrendSpider.com
It's easy to be a pessimist right now. With Amazon, it's even easier. The stock hasn't gone anywhere in months and fell flat on its face after the last earnings report.
News that CEO Jeff Bezos will step down later this year has some investors wary of the future, while the lack of a stock split disappointed others.
Regardless, the stock has come down in the last few weeks, albeit not as badly as growth stocks have.
You will note where resistance held firm, like at $3,344, and where prior support turned to resistance. That observation is evident with the 50-day and 100-day moving averages, as well as prior wedge support (blue line) all turning to resistance.
The 200-day moving average gave us a slight bounce, but the rally wasn't sustained. Now Amazon has my attention though.
The stock is bouncing off the $2,888 level, with a low at $2,881. For a stock this big, $7 a share barely shows up on the chart. Further, the stock is catching a bounce from the often overlooked 50-week moving average.
For those that like Amazon, a long position against a stop-loss below Friday's low may be an enticing play. At the very least, I am looking for a bounce back to $3,000.
Above that puts the 200-day moving average in play, then the backside of prior wedge support. If it gets to this last level, we'll need to re-evaluate it.
From TheStreet.com