Weekly Market Outlook - The Bulls Start the New Year With a Bang
 Though the market ended 2016 on a bearish foot -- skipping the Santa Claus rally altogether -- the bulls were firmly in charge as 2017 got rolling. The S&P 500 gained 1.7% last week, and that was only a four-day week. The index also tiptoed into record-high territory, with last week's close of 2276.98 being a record-high close as well.
Do we take the clues as face value and assume higher highs are in the cards, or was Friday just the last hurrah... the final gasp of buying before the profit-takers dig in? As they say, the trend is your friend, so we have to assume there's more upside ahead. On the flipside, if there was ever a time to plan for all contingencies, this is it.
We'll take a close look at all the possibilities and clues after we quick run-down of last week's and this week's economic news.
Economic Data
While there was plenty of economic data to sift through last week, there's no doubt as to the highlight... December's employment report.
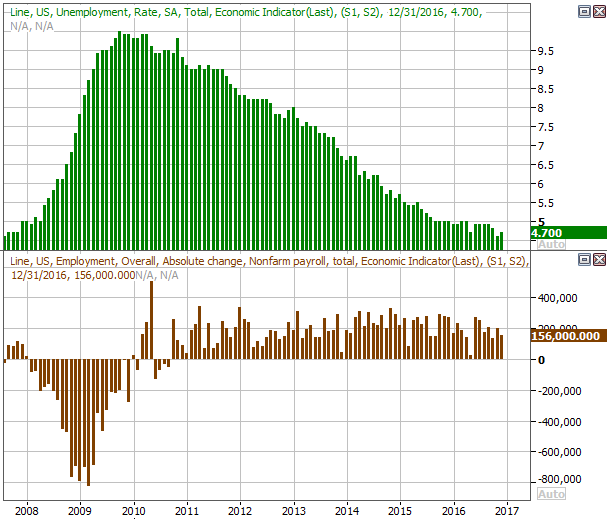
The unemployment rate actually edged a little higher, from 4.6% to 4.7%, but that increase is a purely mathematical one - we actually added 156,000 new jobs last month. We just happened to have a slightly larger number of people move into the labor force pool. Besides, it's difficult to push the unemployment rate lower than it already is.
Job Growth, Unemployment Rate Charts
Source: Thomson Reuters
On the other hand, note that the pace of job growth (prolonged as it may have been) appears to be slowing down. [A deeper, more intense analysis of December's jobs report is available here.]
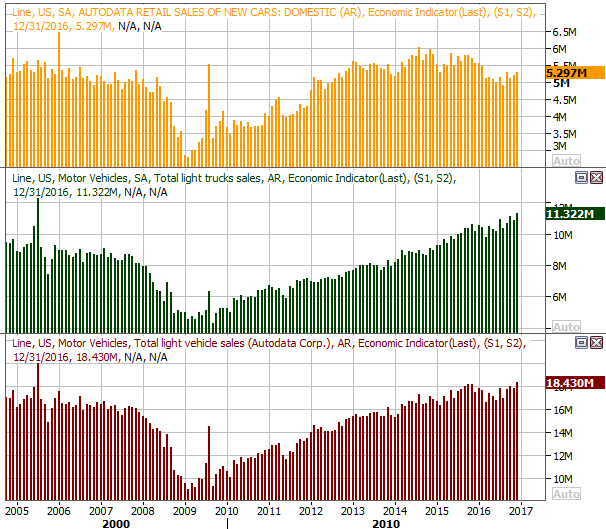
Employment numbers weren't the only big data in the lineup for last week. We also heard about December's auto sales last week. They were good... better than expected. Fears the "peak auto" had been seen have thus far been overblown, though it's conceivable that November's and December's rekindled car-buying is purely the result of economic optimism surrounding a Trump presidency. Then again, that optimism may well be merited. Either way, car sales continue to strengthen.
Auto Sales Charts
Source: Thomson Reuters
The nation's manufacturing industry's managers continue to show optimism, as do the service industry's. The ISM Manufacturing Index surged to 54.7, extending an uptrend, and the ISM Services Index edged slightly higher at another 50+ reading. Any readings above 50 indicate expansion (as opposed to contraction). This is an encouraging economic indication.
ISM Index Charts
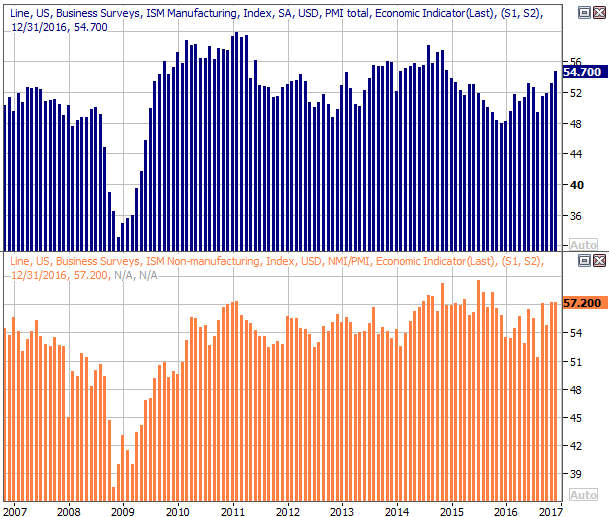
Source: Thomson Reuters
Everything else is on the grid.
Economic Calendar
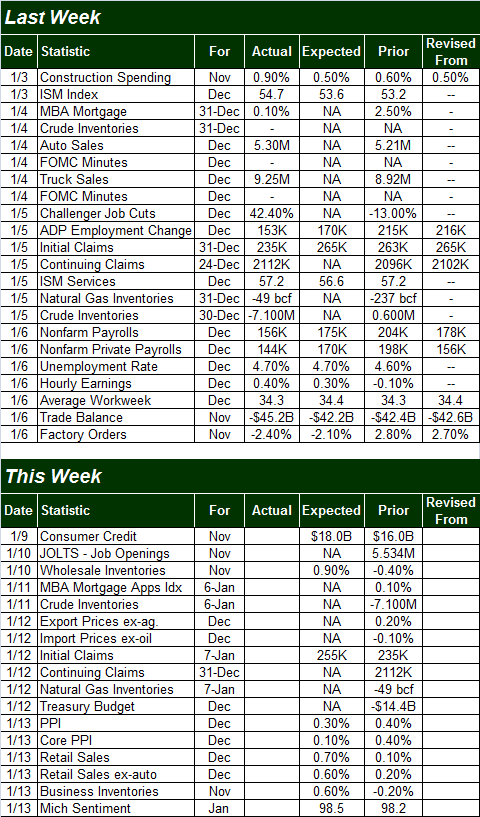
Source: Briefing.com
December's retail sales will be posted on Friday. This is an especially important report, as it will indicate how much consumers spent at a time of year that retailers rely on for big sales. The pros think retail spending was up 0.7% for the month, and grew 0.6% when taking automobiles out of the equation. Those are month-to-month comparisons. The year-over-year comparisons will be significantly bigger. That said, note that the year-over-year growth has not only been decidedly stronger, but appears to be growing again.
Retail Sales Growth (YOY) Charts
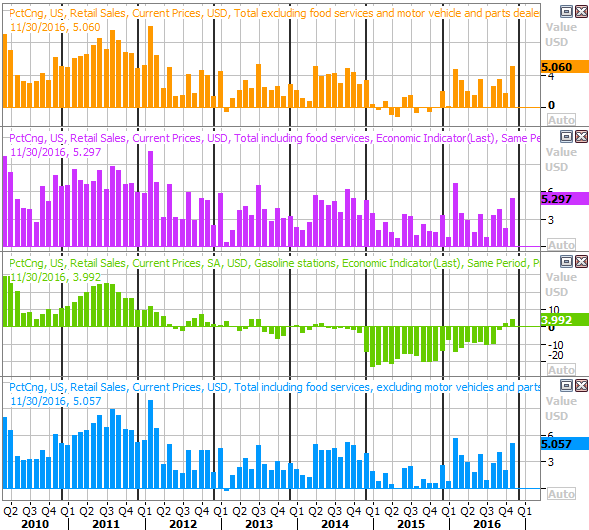
Source: Thomson Reuters
Also on Friday look for last month's producer price inflation numbers; December's consumer price inflation data won't be posted until next week. Still, we can get a taste of the inflationary environment from the PPI report. Economists expect a 0.3% increase overall, but only a 0.1% increase on a core basis. Annualized, the PPI rate now stands at 0.5%, though when taking food and energy costs out of the mix, the PPI rate is 1.8%, and rising fast.
Producer and Consumer Inflation Rate Charts
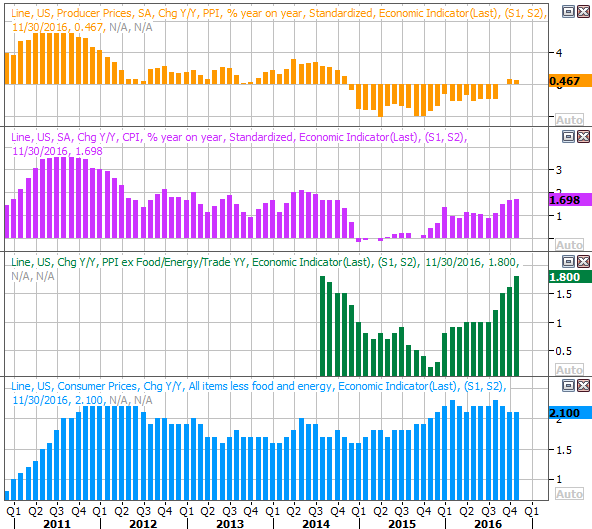
Source: Thomson Reuters
Consumer inflation is also broadly trending higher, and is hovering right around the Fed's target rate.
Index Analysis
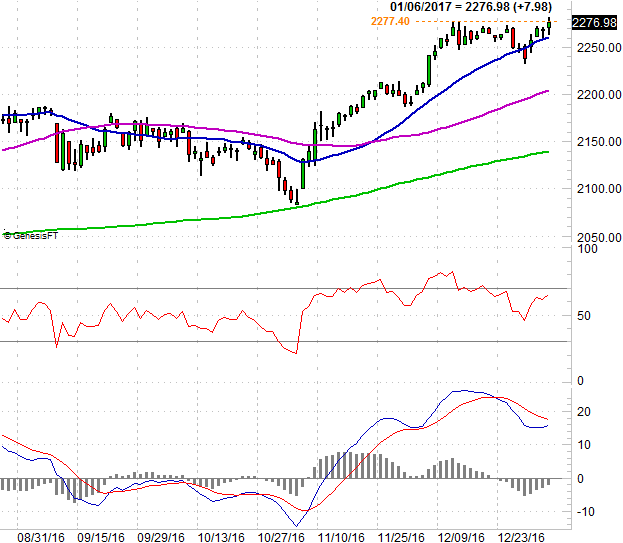
Decisively reversing a bearish end to the previous year, the bulls were firmly in charge during the first week of the new year. The S&P 500 gained 1.7% last week, which was enough to carry it to record highs.
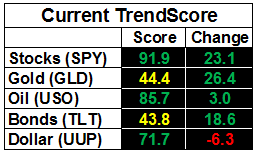
Is this the shape of things to come, or another fakeout before the profit-taking begins again. As momentum followers, we have to be ostensibly bullish. [The BigTrends TrendScore for stocks ended the week at a lofty 91.9 (out of 100)]. But, we know all too well we've been here before, with the VIX at a well-verified floor around 11.2.
S&P 500 Daily Chart
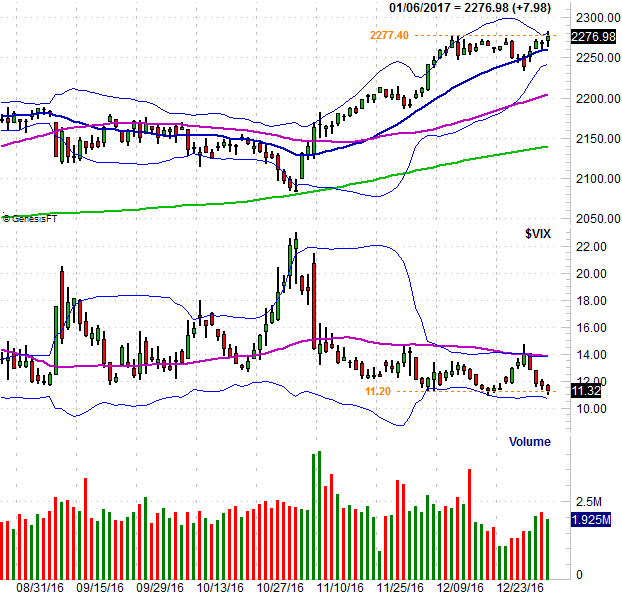
Chart created with TradeStation
Not that the market is ever easy to handicap, but this is a situation where it's even tougher to do so than usual. And it's not as if zooming out to the weekly chart of the S&P 500 adds any more meaningful perspective. Take a look.
S&P 500 Weekly Chart
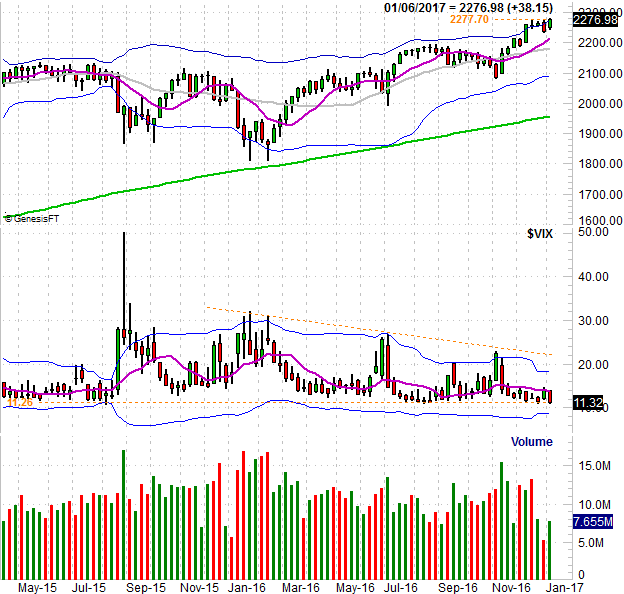
Chart created with TradeStation
It's only in this timeframe, though, we can see just how far the market's come since the February low, and just how overextended it's become. The S&P 500 is now 25% higher than its February low.
The recent bump up into (and above) the upper 26-week Bollinger band was at first a red flag, suggesting a reversal was imminent simply because the rally had gone too far. The bulls have been pushing against the upper band for five weeks now. If they were going to throw in the towel, one would think they would have done so by now.
Still, it's at a time like this the question of risk-vs-reward has to be weighed.
Yes, the market may be in a position to move higher from here (defying the likelihood), but is the upside potential worth the risk? "Bullishness" may only mean a 1% or 2% gain from here. For some traders that's worth the risk of a sudden pullback. For others, it's not.
It's rarely discussed, usually because it's not a factor. But, as of the end of last week, the S&P 500 is 16% higher than its 200-day moving average line (green). That's about the historical sustainable maximum disparity we see between the two, indicating in a different way just how technically overextended -- in the long run -- the market is at this time.
Zooming back in to a slightly different daily chart of the S&P 500, we can see the PercentR as well as the MACD lines remain inconclusive. The PercentR line would need to get -- and stay -- above 80 for us to turn decisively bullish.
S&P 500 Daily Chart
Chart created with TradeStation
The point is, while the short-term undertow is bullish, between the politicization of the market right now as well as where we are in the calendar year (in addition to the fact that stocks are so technically overbought), we need to be prepared for anything.
Should the market pull back, the 50-day moving average line (purple) is the first downside target to watch.