Put/Call Ratio Reaches Dangerous Territory as Stocks Start to Fade
How much is too much? It’s not an easy question to answer for any area, but it’s proven particularly tough as it pertains to stocks. For the past few months, just when it looks like the market can’t climb any higher, it does.
Worse, most of the usual tricks of the trade aren’t working like they used to. There’s one, however, that may put the recent round of bullishness in an enlightening but concerning perspective.
Much of BigTrends’ work focuses on sentiment. That is to say, they’re a great deal of valuable information to be gleaned by how traders feel; the really important stuff is found when traders are unusual fearful or unusually optimistic. Those extremes, counterintuitively, are bullish and bearish, respectively.
It’s a philosophy called contrarianism, meaning we’re bearish when most people are most bullish, and we’re bullish when most people are most bearish. The approach works because most traders are generally late to the party, so to speak. When and if the last of the would-be buyers steps aboard and everyone’s in accord, it usually means the last of the buyers have stepped in. That’s when the smart-money and the big-money starts to step out. And, vice versa.
We use the approach because it works.
It used to work better. There was a point in time when, even as hysterical as trades could become, their irrational behavior was at least consistently irrational, and the same red flags would always wave. That data could even be quantified and verified as a systems-based trading tool. That’s not the case anymore though. Sentiment measures have been pushed just beyond the limits of what could be called ‘consistency,’ making them dangerous to blindly rely on.
From a qualitative point of view though, there’s still a lot of treasure in studying sentiment measures, and cross-referencing them with other perspectives on the market.
One of our favorite tools to use as a sentiment gauge is the put/call ratio of equities, or stocks. This data indicates the degree to which more speculative bets – both bearish and bullish – are being made on stocks in general. More specifically, a comparison of how much bullish betting (calls) and how much bearish betting (puts) is being done can reveal a great deal about how traders collectively feel about stocks at any given moment. A very high put/call ratio indicates a lot of fear, and a low put/call ratio indicates a great deal of optimism, or even greed.
The daily value of the put/call ratio is generally too volatile to use as a trading tool. By plotting a moving average of that daily data though, we can spot a trend. We can also spot points in time when that trend says traders have been too bullish for too long, or too bearish for too long.
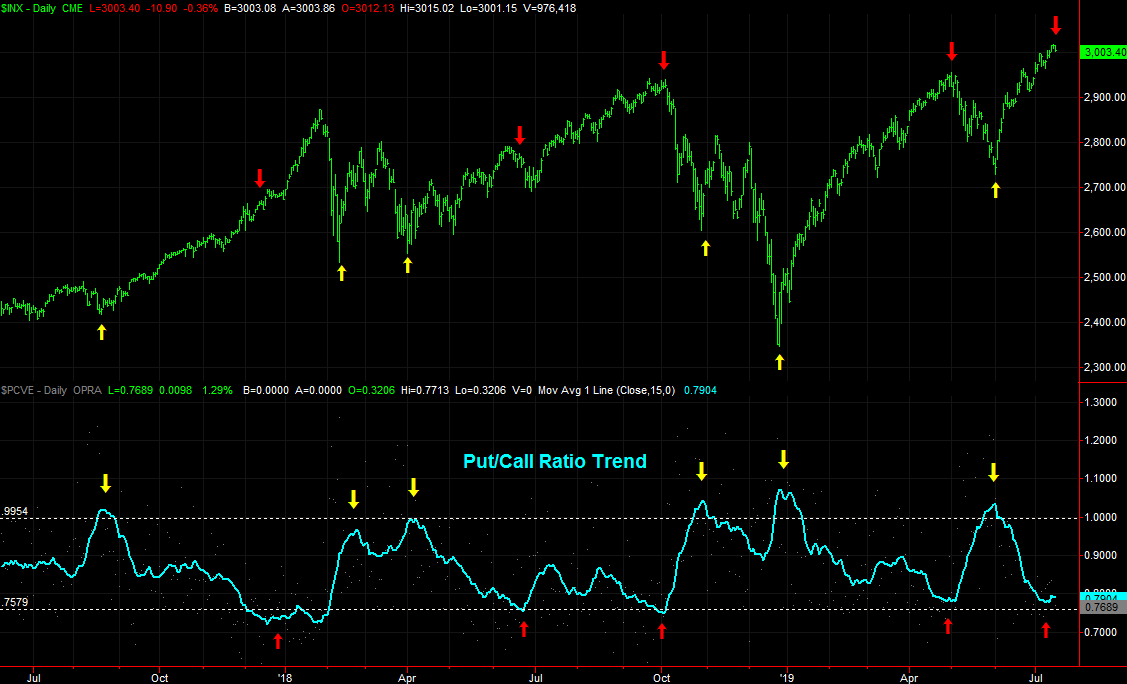
Our graphic makes that clear, comparing the S&P 500 to the put/call ratio’s trend. Though most of the time the put/call trend is in the middle ground that means nothing, when it moves to extreme highs above 1.0 and fear is peaking, a bottom is usually being made. Conversely, when the put/call ratio trend falls below 0.8, it usually occurs at a market top.
The put/call ratio moving average line, or trend line, is below 0.8 right now, and teasing of a move higher. That’s historically been bearish for the market.
It’s not a bulletproof tool. The market can stay oversold and stay overbought for long stretches. Ditto for the put/call ratio. More often than not, however, there tends to at least be a small something to it when the put/call ratio trend reaches extreme values. It certainly is a concern right now, when paired with other unrelated red flags that suggest the bulls and buyers have done about all the lifting they’re going to be able to do for the time being.
If the put/call ratio isn’t part of your trading arsenal, you may want to incorporate it into your routine.
To that end, note there are several different versions of the put/call ratio, and they’re not all built the same. Some look at marketwide activity, while others examine puts and calls for a particular index.
Our look is one at the market’s total equity puts and calls, which incorporates the long tail of options traded on smaller stocks, but excludes index options. We prefer to ignore the index option trading data because so many hedge funds and institutional traders (and ETFs) are using index-based options that it skews the data. In other words, index-based options don’t indicate clear optimism or pessimism about stocks in general. They’re often just tools bought or sold by traders with no particular opinion at all. That doesn’t do sentiment analysts like us a whole lot of good.
Still, that’s not to suggest there aren’t other put/call ratios that could have value to you. The trick is often just developing an interpretation that yields consistent, reliable results.
If you’d like to learn more about trading techniques and data interpretation that’s not being taught anywhere else – because proprietary traders want to keep such information to themselves – BigTrends offers a series of ‘Boot Camps’ that help traders get more out of the market.