-- Call options' open interest is on the rise. --
Investors have bid down the share prices of Pfizer Inc. (PFE) after the company announced earnings results for the fiscal fourth quarter. After reaching a 52-week high in late December 2021, Pfizer shares slid to start 2022. Analysts had expected the pharmaceutical giant to announce $0.85 in earnings per share (EPS) and $23.8 billion in revenue. Pfizer matched revenue expectations and beat on EPS, reporting $1.08 in EPS for the quarter. The company's COVID-19 vaccine contributed $12.5 billion in global revenue, more than half of the company's total revenue for the quarter.
The COVID-19 pandemic has been a boon to Pfizer, as the company's stock has risen 47% in the past year. In the previous quarter, the FDA extended the Emergency Use Authorization (EUA) for the booster dose of Pfizer's COVID-19 vaccine, in addition to granting emergency approval to the vaccine for children 5 through 11 years of age. In December 2021, the FDA also granted EUA to Pfizer's oral COVID treatment Paxlovid, an at-home treatment meant to help fight mild-to-moderate COVID-19 infection.
Option traders have taken these developments into consideration and appear to be positioning themselves for the Pfizer share price to rise in the near term. That's because recent trading volumes and the open interest for Pfizer stock skew bullishly, suggesting that traders have been buying call options while selling puts.
Key Takeaways
- Traders and investors have bid down the share prices of Pfizer after earnings.
- The Pfizer share price recently closed below its 20-day moving average.
- Pfizer has underperformed some of the top stocks of the healthcare sector.
- The volatility-based support and resistance levels allow for a stronger move to the upside.
- Put and call option activity appears to be positioned for the share price to rise in the future.
Recent Healthcare Sector Performance
Pfizer is a top ten holding of State Street's Healthcare Sector ETF (XLV). The sector has recently performed just ahead of the market at large. XLV has fallen 5.2%, while State Street's S&P 500 Index ETF (SPY) has shed 6% year-to-date. The chart below illustrates the recent performance of XLV compared to Pfizer and nine of the top sectors of the S&P 500.
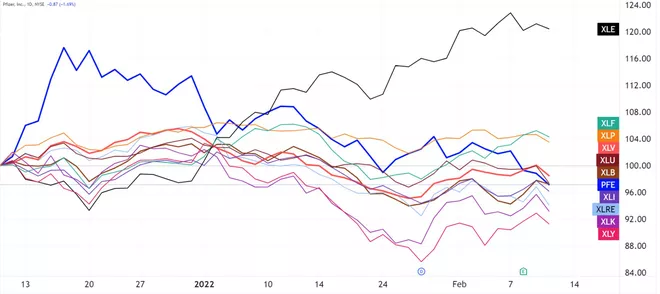
It's notable on this chart that sector rotation appears to show that investors are positioning themselves to be prepared for the increase of interest rates to combat inflation. The top performing sectors-energy (XLE), consumer staples (XLP), financials (XLF), utilities (XLU), and healthcare (XLV)-are considered relatively "safer" bets during times of rising inflation and interest rates.
Nearly all of these sectors reflect "necessities" and are considered sectors where consumers will focus their spending power in inflationary environments. It's notable that, in this time period, Pfizer itself outperformed each sector in late December, only to fall toward the upper range of stocks in this comparison.
Inside the Healthcare Sector
The healthcare sector consists of businesses that provide medical services, manufacture medical equipment or drugs, provide medical insurance, or otherwise facilitate the provision of healthcare to patients.
The healthcare sector could be considered a good investment in a rising interest rate environment because people always need medical care. Demand in this sector is relatively immune from inflationary pressures. Contractual arrangements with health plans and providers also limit the ability to adjust for inflation. The chart below compares the recent performance of Pfizer with the top holdings of State Street's Healthcare sector ETF (XLV).
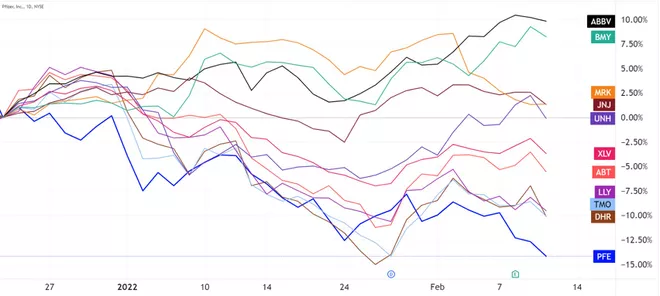
This chart helps to highlight how stocks in this sector have run a wide gamut in terms of performance. Notably, despite being a top three holding of XLV, Pfizer has lagged each other stock in the sector.
As one of the main providers of a COVID-19 vaccine, the expectation could be that Pfizer stock would outperform the sector. The recent performance of Pfizer is in stark contrast to the company's main competitor in the COVID-19 space, Johnson & Johnson (JNJ). The chart below compares Pfizer with Johnson & Johnson, XLV, and iShares' U.S. Pharmaceuticals ETF (IHE).
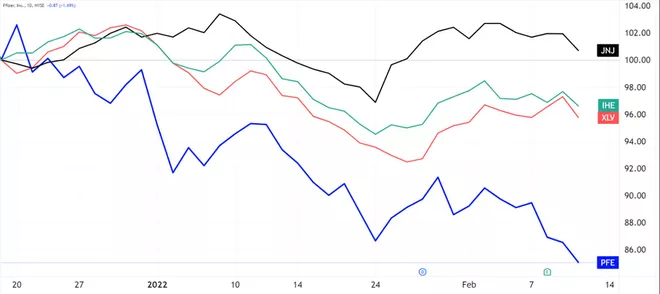
This chart highlights the wide gulf between the recent performance of Johnson & Johnson and Pfizer. While each are top-three holdings of XLV, Johnson & Johnson and Pfizer account for more than 20% each of the weighting of IHE. Despite being one of the top components of IHE, Pfizer has still greatly underperformed IHE in recent terms. These chart comparisons could highlight recent sentiment toward Pfizer stock compared to competitors in the sector and the sector at large after the company's earnings report.
Price Action and Option Activity
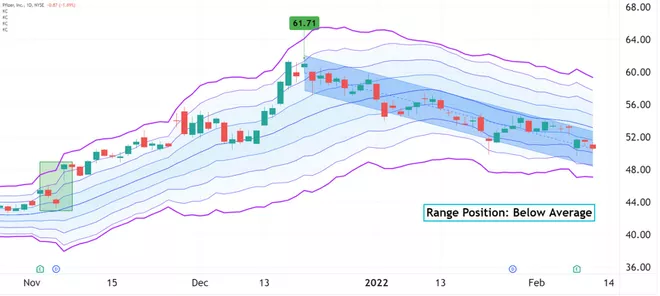
An analysis of recent option activity combined with technical analysis of share price movement can help chart watchers gain valuable insight into the overall sentiment toward Pfizer stock. The chart below depicts the recent price action for the Pfizer share price as of Thursday, Feb. 10.
The chart illustrates how the Pfizer share price traded in an extreme high of the volatility range from the prior earnings report to its 52-week high, denoted with the green price bubble, in late December. From this point, Pfizer stock trended gradually downward, closing in a slightly below average area under the 20-day moving average. This trend is highlighted in blue.
The purple bands on this chart are an extreme historical volatility range formed by 4 standard deviations of 20-day Keltner Channel indicators, which depict price levels that represent a multiple of the average true range (ATR) for Pfizer stock. ATR is a standard tool for illustrating historical volatility over time. These bands could be considered to represent the extreme ranges of option pricing.
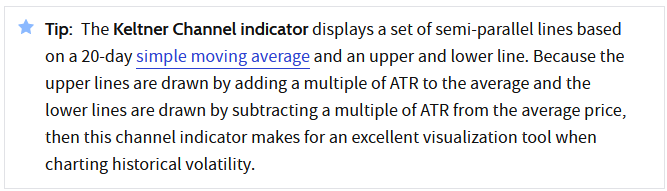
The Keltner Channel indicator displays a set of semi-parallel lines based on a 20-day simple moving average and an upper and lower line. Because the upper lines are drawn by adding a multiple of ATR to the average and the lower lines are drawn by subtracting a multiple of ATR from the average price, then this channel indicator makes for an excellent visualization tool when charting historical volatility.
It's notable that these bands widened in late December as Pfizer stock reached its 52-week high and have since been narrowing. This could mean that option pricing is tightening after Pfizer's earnings announcement. The tightening of these bands means that volatility is falling, which usually occurs when option market makers are pricing in less fear of a downside move to option prices.
Recent option trading volumes for Pfizer slightly favor calls over puts. This is tough to consider solely by itself, especially considering the wider market conditions. In addition, the open interest features 1.3 million calls compared to 983,000 puts. Both of these figures reflect a bullish outlook toward Pfizer stock; however, further analysis is required.
The average true range (ATR) has become a standard tool for depicting historical volatility over time. The typical average length of time used in its calculation is 10 to 20 time periods, which includes two to four weeks of trading on a daily chart.
For Feb. 18, the next monthly option expiration date, the single option with the highest open interest is the $55 call, with 64,000. This option represents 9% upside from the current share price. The next highest open interest remains on the $60 call, with 48,000. This represents 19% upside to the current Pfizer share price. The open interest on these two strikes alone account for 33% of the total open interest for Feb. 18.
Implied volatility is trending higher for these strikes with large open interest after earnings, implying that traders are taking long positions in these options. However, it should be noted that implied volatility and open interest are also rising for the Feb. 18 $55 put after earnings, which has an open interest of 29,000.
An analysis of prior option trading volumes indicates that there could be a significant number of straddles at the $55 strike. This position involves simultaneously buying a call and a put and profiting when the stock moves further in either direction than what a trader has paid for the position. Based on current option pricing, a $55 straddle would cost $4.38 total for both legs of the contract and would be profitable with an earnings-based move of more than 8% in Pfizer stock.
Wrapping Up
The Pfizer share price has fallen from an extreme high of the volatility range from late December to a below average range just below the 20-day moving average after earnings. Option traders appear to be buying large amounts of call options after earnings, implying a bullish sentiment. If these bets were to unwind, it could place unexpected downward pressure on the Pfizer share price. However, there is far more room in the volatility range for a move to the upside.
From Investopedia