How Bitcoin Could Break to New Lows (and How It Can Avert It)
-- Bitcoin is trying to avert its third straight weekly decline. Here's what the charts say. --
By Bret Kenwell, TheStreet.com
Bitcoin prices haven't been excluded from the recent selloff.
While the S&P 500 is working on its third straight weekly decline, bitcoin is trying to avert its third straight weekly drop.
Cryptocurrencies proved to trade well in anticipation of high inflation, but it was likely the correlation with high-growth stocks and risk-on assets that powered the run higher.
Bitcoin prices exploded after the 2020 covid-19 selloff but have since performed the way growth stocks have.
Prices fell 75% and bottomed in mid-June, just as many growth stocks did earlier this summer. Now, bitcoin has been moving lower again and some investors fear that a painful crypto winter could be on the horizon.
Last week, bitcoin broke below $20,000 but found its footing shortly after. Now that it's hovering around this level - and currently just below it - let's take a closer look at what could be on tap.
Trading Bitcoin
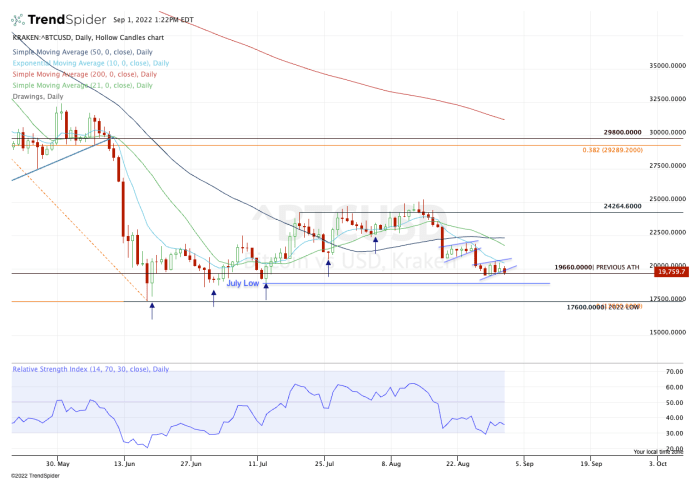
Daily chart of bitcoin
Chart courtesy of TrendSpider.com
Earlier this month, I noted how bitcoin was trying to break out over the $24,500 to $25,000 zone. If it could do so, it would put the $29,000 to $30,000 area in play. But if it lost its 10-day and 21-day moving averages - active support - it was setting up for more potential downside.
The latter played out, and now traders have seen these active support measures turn into active resistance.
This is a great example of why traders need to be flexible and willing to change gears. They either need to get out of their long positions once the script flips or they have to be willing to get short.
On Aug. 19, bitcoin prices fell 10% on the day, sending it below the 50-day moving average. From there, it formed a bear flag pattern, which broke to the downside. Now it's setting up in another bear flag pattern.
The bulls do not want to see bitcoin break $19,500. If it does, it will thrust bitcoin below the recent low, while keeping it below the psychologically key level of $20,000, as well as the prior all-time high of $19,660.
It will also put it below the August low, technically triggering a monthly-down rotation. Buyers have shown up around $19,000 this summer, but if we get a real flush to the downside, don't be surprised if bitcoin revisits the low near $17,600. Below that and new lows are on tap.
So how can bitcoin go higher?
On the upside, it's simple: It must reclaim $20,000 and the 10-day moving average. If bitcoin can do that, it could make a push up to the 21-day moving average and potentially the $22,500 area.
From TheStreet.com