Gold Prices Are Toying With a Major Breakout Move
In Wednesday's Midweek Update Video, Bigtrends.com chief Price Headley dissected several charts, most of which were rallying with the market (and some of which were doing so not only despite the surge in inflation last month, but because of it). Gold was at the top of the list, and for good reason. Not only was it already in a swing uptrend, its inflation-hedge properties made it a highly-sought trade on Wednesday.
Thing is, the move from gold deserves a much, much closer look. The rekindled rally is not only bullish on the surface, it almost completes a major breakout pattern that's been brewing for months.
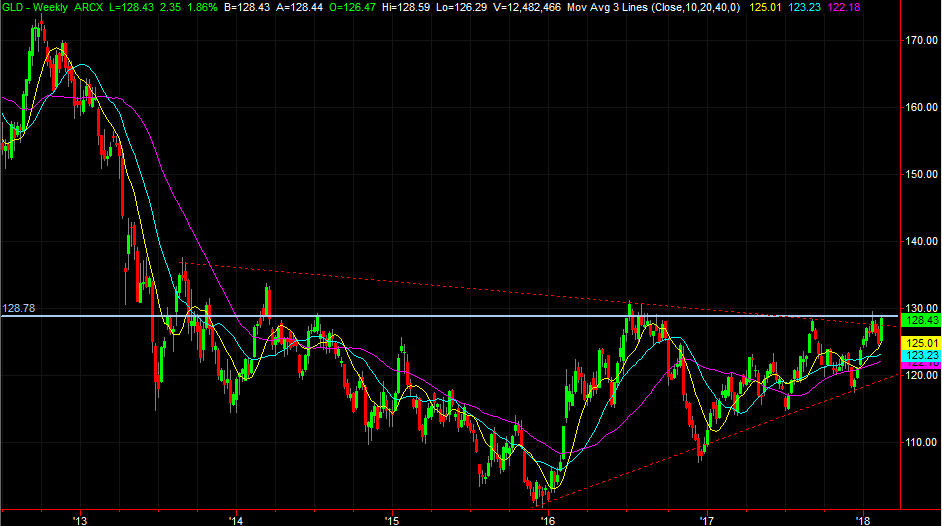
We have to zoom out to a weekly chart of the SPDR Gold Trust (GLD) to fully appreciate what's happening here. As you can see, though erratic the whole time, GLD - and gold prices themselves - have logged a string of higher lows since early 2016 that form a relatively straight line. At the same time, all of the major highs going back to the middle of 2013 (the last hurrah for that year) also form a straight line. The end result is a converging wedge pattern framed by red, dashed lines.
Yes, the SPDR Gold Trust has just moved above the upper edge of that triangle pattern.
There's still one hump to clear. That's the horizontal ceiling at $128.78, plotted in light blue. It's not a hard-and-fast resistance level, though it's been touched too many times since 2014 to say it means nothing now. If GLD can get and stay above that mark, there's little left that can hold gold prices back.
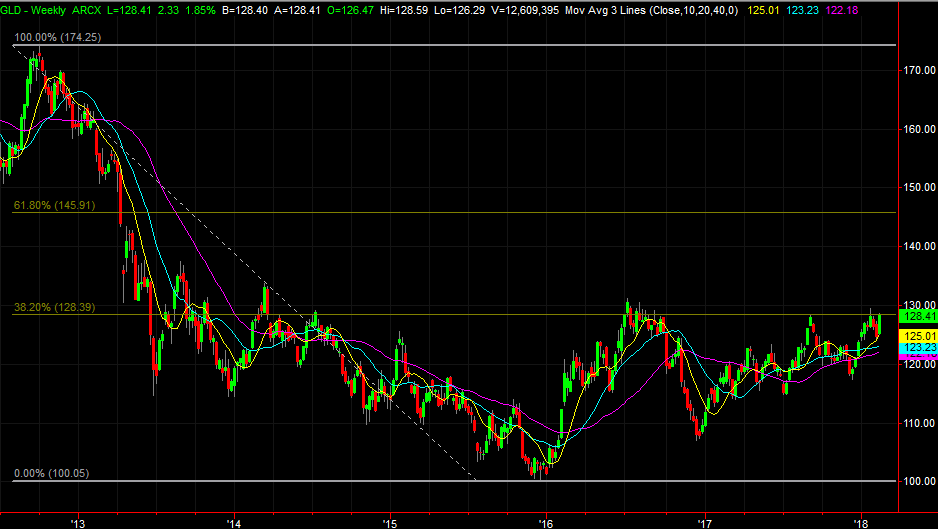
There's one more curious technical matter in play now as well, bolstering the idea that the $128.78 level means so much. That also happens to be where a key 38.2% Fibonacci retracement line (of the span from 2012's peak to 2015's low) lies... where you'd expect the bulls to pause for a psychological regrouping. [Go here to learn more about Fibonacci lines.]
The concern here, of course, is that today's pop is merely a knee-jerk reaction to the inflation headlines. Once the panic subsides, so will the purchasing of gold. That's a superficial assumption, however, and doesn't give traders enough credit for 'knowing' that inflation has been and will continue to be firm. In other words, today's CPI figures weren't exactly a surprise, nor is the uptrend 'new.' The slow buildup of this breakout move is the market's subconscious way of saying it's known inflation was a threat all along.
Whatever the case, things are getting real interesting, real fast for gold. It's been a relatively unpopular trade for a long while now, but that could be changing soon. One or two more good days could do the trick.
The next likely ceiling for GLD, by the way, is $145.90. That's where the other key Fibonacci retracement level - the 61.8% retracement of the peak-to-trough move - currently lies.