
- Facebook has been on fire but the stock eventually will pull back. Here's where to buy the dip in the shares. -
By Bret Kenwell, TheStreet.com
After a difficult 2018, Facebook (FB) found its groove in 2019. That momentum has continued into 2020, as shares hit new all-time highs this week.
It’s the stock’s first new all-time high since July 2018, and while that may not seem like that long, consider that Apple (AAPL), Microsoft (MSFT) and Alphabet (GOOGL) have been making this feat nearly routine for a while now.
In any regard, Facebook stock is there now too, as shares continue to push higher. It’s got investors wondering just how high the stock can go. According to Cowen analysts, the answer may be $245, which is the price target they published on Thursday to go alongside a buy rating.
Can it get there? It can, but a pullback would be nice first.
Trading Facebook Stock
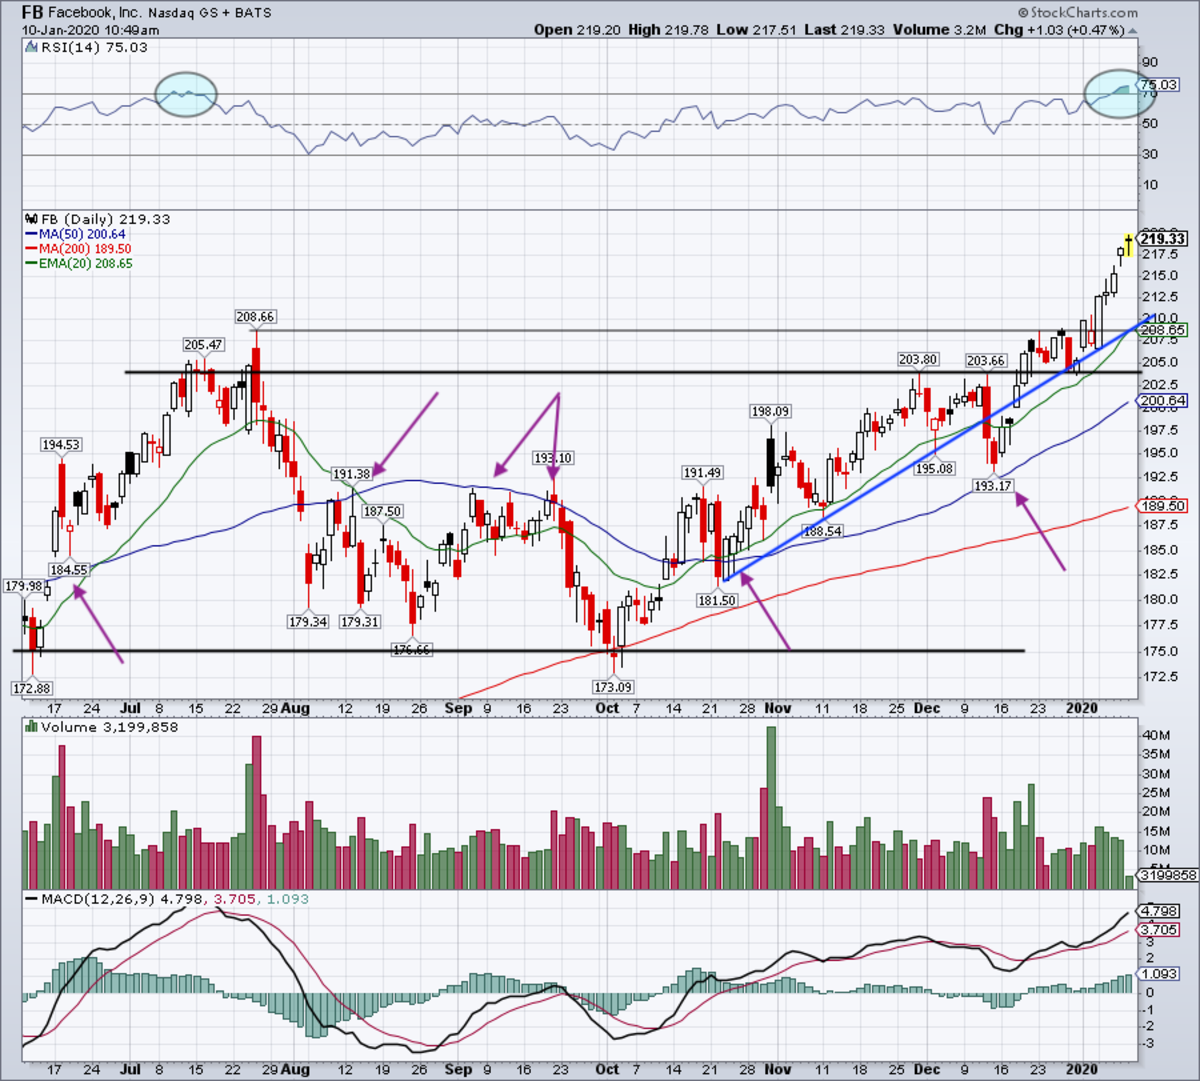
Daily chart of Facebook stock.
Chart courtesy of Stockcharts.com
With earnings set for Jan. 29, investors may continue to bid up Facebook into the event. If that’s the case, it will put bulls in a precarious spot as expectations will be very high in that scenario.
Given its run, many investors are looking for a dip to buy. For short-term traders, they may look for a pullback down to the 20-day moving average, and the $210 to $212.50 area. Should shares correct to the 20-day, buyers will also find uptrend support (blue line) nearby.
That uptrend support mark is highlighted on the weekly chart as well, which is below.
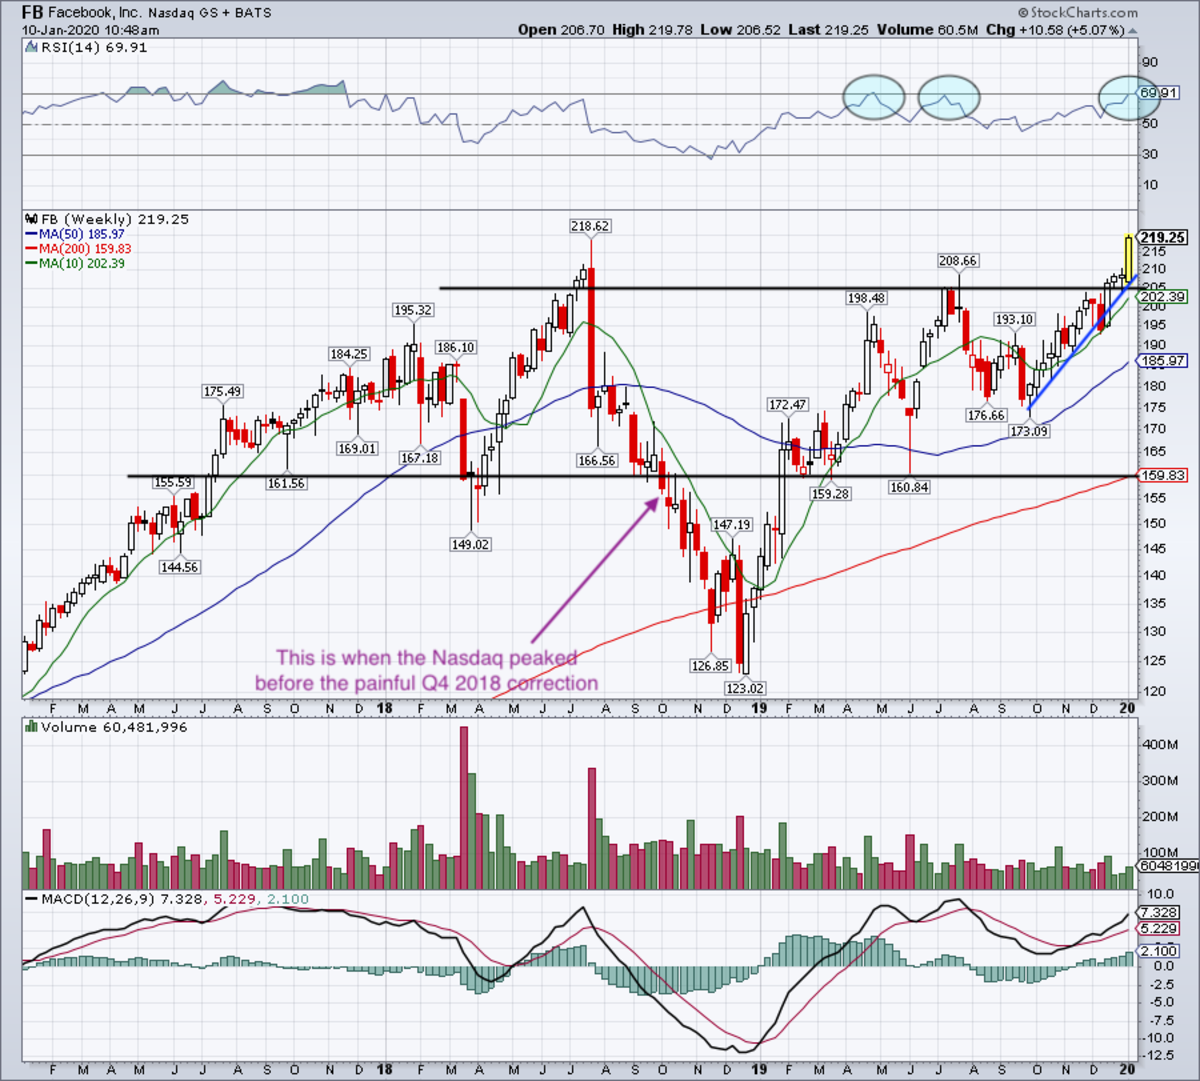
Weekly chart of Facebook stock.
Chart courtesy of Stockcharts.com
While a dip to this area will likely draw in dip-buyers, a larger pullback could help take out some of the froth. That’s evident on both the daily and the weekly charts.
On the weekly chart, the significance of the $205 level is pretty clear. Facebook stock broke out over this mark in December, and it would be an excellent sign to see it act as support on a larger dip. Plus, the 10-week moving average is just below this mark and trending higher.
On the daily chart, the 50-day moving average is at $200.64 and trending higher. As the purple arrows highlight, the 50-day has played a pivotal role for some time.
The bottom line? A quick dip down the 20-day moving average may provide a bounce, while a larger drop down to the $205 level and/or 50-day moving average may provide a better opportunity. While technically overbought, it doesn’t mean that Facebook can’t go higher before its eventual correction.
From TheStreet.com