BigTrends.com Weekly Market Outlook - November 28, 2016
BigTrends.com Weekly Market Outlook - Will The Rally Sputter?
The volume may not have been great behind the shortened trading week's gains, but a gain in a gain nonetheless. And, this one was particularly noteworthy in that all the major indices made their way into record high territory.... at a time when they weren't supposed to.
Can it last? That's the $64,000 question. From a momentum and technical perspective, the picture is bullish - yes, there's reason to expect more upside from here. But there is reason to believe the rally may sputter soon and possibly roll over to the downside. This week is going to be interesting.
We'll look at the risks and rewards below, after taking a look at the bevy of economic news unveiled last week, and previewing this week's economic news.
Economic Data
Last week was an especially bug week for real estate news, with October's existing-home sales report coming on Tuesday, and new-home sales being posted on Wednesday. Both were good. Sales of existing homes ticked higher, from 5.49 million to a multi-year high of 5.6 million. New home sales slumped a bit, from a pace of 574,000 to 563,000. Still, the bigger trend of new home sales remains pointed upward.
New & Existing Home Sales Chart
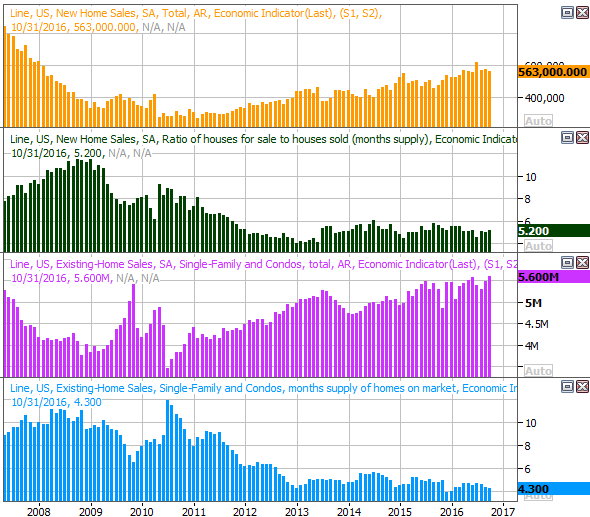
Source: Thomson Reuters
Though not charted, note that the FHFA Housing Price Index edged up in September as well, extending a multi-year uptrend.
Last week also dished out a pretty impressive durable orders figure... even without factoring in transportation orders. Ex-transportation, orders grew 1.0%, and were up a hefty 4.8% with transportation ordered factored in. October's orders were a welcome improvement following a lackluster September report. More important, we've seen a pretty solid streak of year-over-year improvement.
Durable Orders, Year-Over-Year Growth Chart
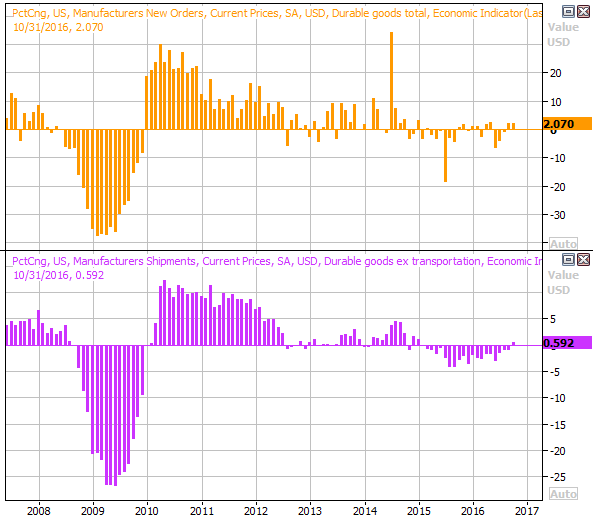
Source: Thomson Reuters
Everything else is on the following grid:
Economic Calendar
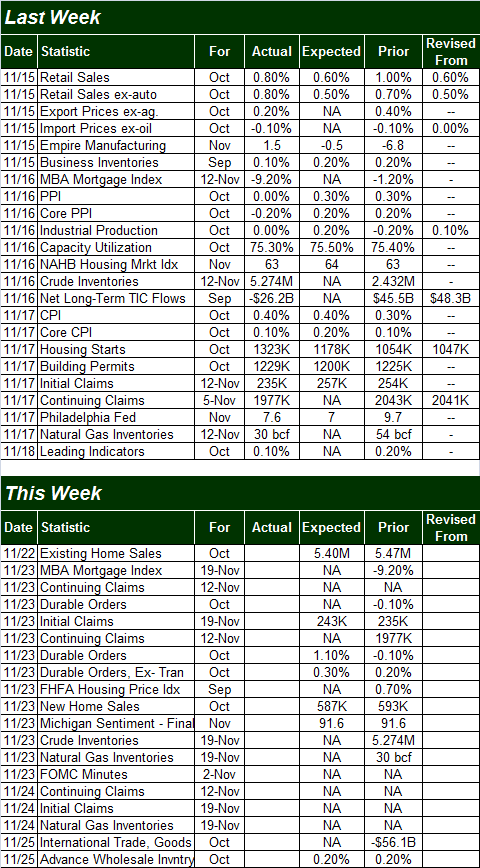
Source: Briefing.com
This week is going to be overwhelmingly busy, kicking off on Tuesday with the second (of three) Q3 GDP growth reports. Economists have pumped up the growth rate from 2.9% to 3.0%, though bear in mind that's still not a final tally.
We'll also hear October's consumer confidence number on Tuesday, rounding out last week's third and final reading of the Michigan Sentiment Index. We're seeing strength here, at a time when we needed to rebound. The pros say we're going to forward progress again, which could really go far in convincing the bulls the upward undertow is for real.
Consumer Sentiment Chart
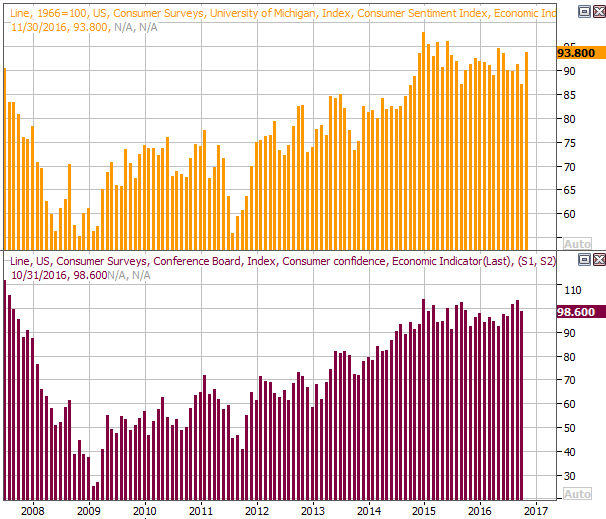
Source: Thomson Reuters
That's still not the only noteworthy economic news coming on Tuesday though. The Case-Shiller 20-City Index reading for September will be unveiled that day as well, rounding out last week's FHFA Housing Price Index. Both sets of data are a month behind, but the bigger trend is still promising... on both fronts.
Home Price Chart
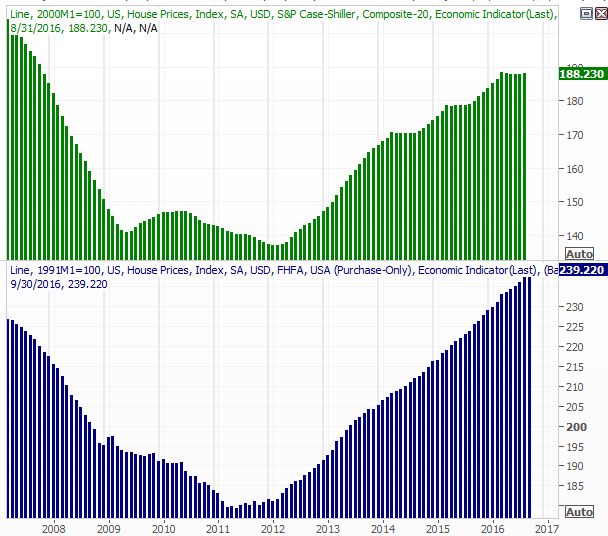
Source: Thomson Reuters
The biggie for the week, however, is Friday's employment report. Analysts are looking for the addition of 180,000 new jobs, up a bit from September's 161,000 new jobs. That shouldn't be enough to move the unemployment rate dial from 4.9% though.
Payroll Growth and Unemployment Rate Chart
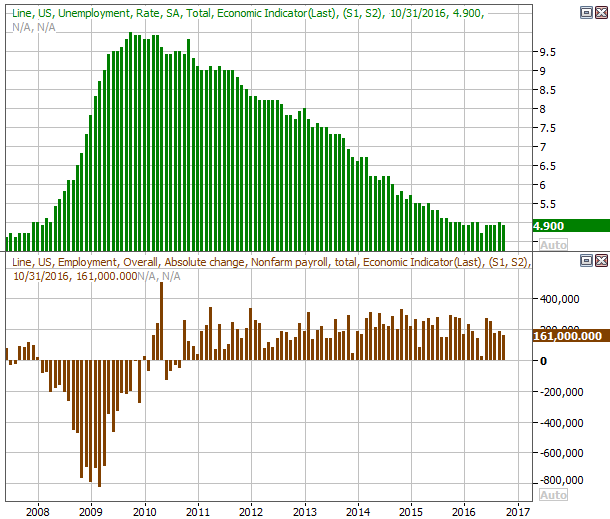
Source: Thomson Reuters
It would be wise to look beyond the employment data headlines and ferret out information regarding things like the labor force participation rate and the number of people who are not being counted as part of the labor force but would like a job. The basic data isn't telling the whole story anymore.
Also note that we'll get something of a preview of October's payroll growth figure on Wednesday, with last month's ADP employment change report.
Stock Market Index Analysis
We'll start this week out with a look at the weekly chart of the S&P 500 (SPX) (SPY), just because it's important paint the bigger picture first.
In this timeframe you can see just how bullish the past three weeks have been following the kiss of the 200-day moving average line (green) four weeks ago. In many ways the three-week move looks a great deal like the reversal effort from early July. It's worth noting, however, that the three-week rally seen in July started to fade by the beginning of the fourth week, and was rolling over four weeks later as the market struggled to refill the gas tank.
S&P 500 & VIX Weekly Chart
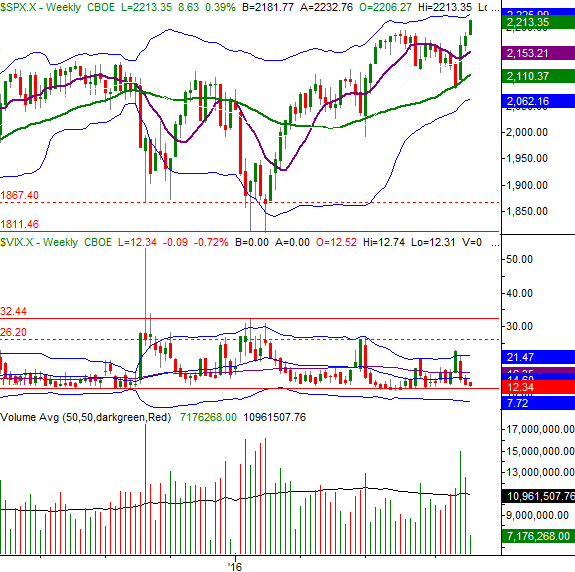
Chart created with TradeStation
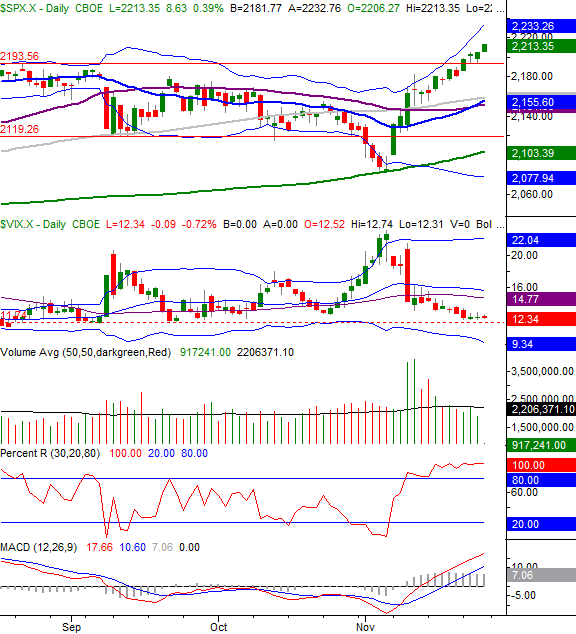
The CBOE Volatility Index (VIX) (VXX) is also within reach and sight of a major technical support level around 11.7. While it is possible for the S&P 500 to keep moving higher even with the VIX as low as it is, it's unusual for it to rally well with the VIX hovering near absolute lows.
Still, there's a distinct possibility that if the market is going to roll over (or even slow down) here, it will want to lure a few more buyers in before lowering the boom. That may mean one last thrust t the upper 26-week Bollinger band - currently at 2226 - before running out of steam.
Then again, there's always the possibility investors could decide a business-friendly Trump is a reason to keep buying stocks despite them being overbought and overvalued. Indeed, the daily chart of the S&P 500 shows raw momentum, with the bull trend being confirmed by the fact that the Percent R line has gotten above, and stayed above, the 80 threshold.
S&P 500 & VIX Daily Chart
Chart created with TradeStation
Bottom line: This is essentially a coin toss right now... even more so than usual. For the rally to last in a meaningful way, odds and common sense will have to be defied by hope and euphoria. Conversely, if the market is to dish out a pullback, it will have to do so in defiance of its current momentum. This is always the duality to some degree, but the situation is far more extreme than usual at this time. Tread lightly here, and be prepared for anything.
Fed Interest Rate Outlook
It's not exactly a secret that traders are pricing in higher interest rates in anticipation of a Fed Funds rate hike next month. What may be underappreciated, however, is the extent to which traders are making that bet. The market has priced in a 94% chance of the Federal Reserve's base rate ticking higher in December.
The odds of the Federal Reserve holding rates there -- after just one rate hike -- are good through April of next year. But, as of June, the market is expecting a second rate hike. They're expected to remain there all the way through the end of next year.
Fed Funds Outlook Chart
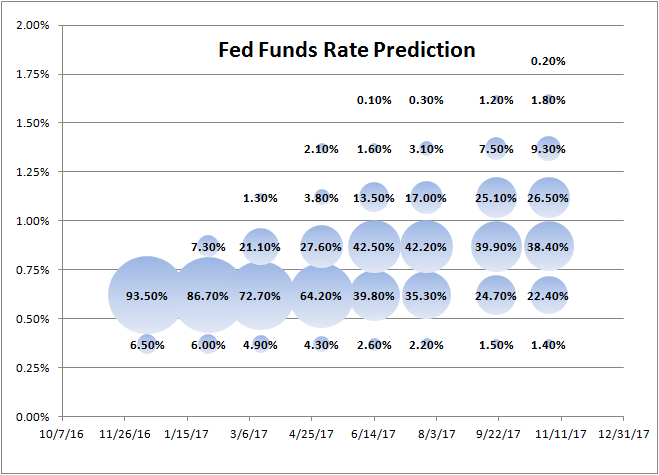
Data Provided by CME Group
Trade Well,
Price Headley
BigTrends.com
1-800-244-8736