Apple (AAPL) Trending Lower as Quarterly Report Approaches
-- Put options rising in open interest --
Apple (AAPL) steadily rose for much of the quarter, the largest stock by market cap has been in a downward trend for much of 2022. Apple is trading well below its 20-day moving average ahead of its fiscal first quarter earnings announcement. Analysts expect the iPhone producer to announce $1.89 in earnings per share (EPS) along with $118.53 billion in revenue. This represents 12% growth in profit and 6% growth in revenue expectations on a year-over-year basis. The estimated growth since the same quarter one year ago represents the lowest growth estimates for Apple in the previous four quarters.
As the wider market has digested steadily growing inflation, technology stocks in particular experienced a sharp pullback from pandemic-era highs. Apple, despite setting a record high to start the year, has shed 12% since the start of 2022, as investors appear to be rotating out of the technology sector for the time being. Apple has also experienced a struggle on two fronts: supply chain constraints and an ongoing chip shortage.
Consider that the open interest for Apple consists of a larger number of call options than puts. The implied volatility built into those prices suggest that traders are selling calls and buying puts, representing speculative downside bets on the Apple earnings results. Unwinding these bets could place significant upward pressure on the share price of Apple stock.
Apple stock was the recipient of several price target upgrades as recently as December 2021. Since that time, the recent upward trend of Apple has reversed. As inflationary worries persist, investors could be concerned that the company provides less opportunity for upside growth in the near term.
Price Action
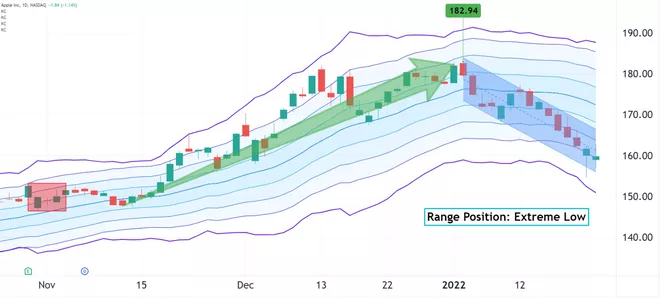
A comparison between technical analysis of share price movement and recent option trading activity can grant chart watchers valuable insight into the overall sentiment toward Apple stock ahead of the earnings announcement. The chart below illustrates the recent price action for the Apple share price as of Tuesday, Jan. 25.
The chart depicts how Apple shares embarked on a long upward trend after reporting earnings for the previous quarter, highlighted by the green arrow. The Apple share price rose to an extreme high of the volatility range, marked by the purple bands, and set a record high of $182.94 in early January 2022. From this point, the upward trend reversed to the downside, falling below its 20-day moving average and closing in an extreme low of the volatility range on this chart.
The purple bands on this chart are an extreme historical volatility range formed by 4 standard deviations of 20-day Keltner Channel indicators, which depict price levels that represent a multiple of the average true range (ATR) for Apple stock. ATR is a standard tool for illustrating historical volatility over time. These bands could be considered to represent the extreme ranges of option pricing.
It's notable that these bands briefly widened in mid-December and appear to be widening yet again as earnings approaches. This could mean that option pricing is growing ahead of the Apple earnings announcement, which could translate into investor uncertainty regarding the report.
The Apple share price could be facing macro headwinds at the moment. Investors appear to be fleeing the technology sector in preparation for an increase of interest rates and a shift into the next phase of the economic cycle.
TIP: The average true range (ATR) has become a standard tool for depicting historical volatility over time. The typical average length of time used in its calculation is 10 to 20 time periods, which includes two to four weeks of trading on a daily chart.
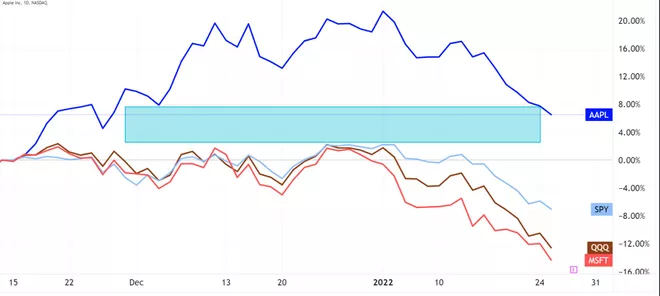
The chart above compares the recent performance of Apple with main competitor Microsoft Corporation (MSFT), State Street's S&P 500 Index ETF (SPY), and Invesco's Nasdaq-100 ETF (QQQ). The chart helps to highlight how Apple managed to outperform both major indexes and Microsoft before the start of 2022, yet during the new year, both the major indexes and the leading stocks by market cap are experiencing downturns.
Indeed, since the start of 2022, while Apple has fallen by 12.2%, Microsoft has fallen 13.8%. As the top weighted holdings of QQQ by a wide margin, it's no surprise that the technology index has shed 14% in 2022. SPY, meanwhile, has performed best of the four, having given up only 9% year to date.
The blue box on this chart is meant to highlight the large divergence between Apple and the trio of Microsoft, QQQ, and SPY. Seeing as Apple and Microsoft account for 22% of the holdings of QQQ and 12% of SPY holdings, this performance gap between Apple and the rest is alarming. This could mean that Apple could catch up with the group, or the group could close the gap with Apple.
Option Activity
As the Apple share price has remained in a downward trend, it seems that option traders are positioning themselves for the share price to continue to decline in the near term. Recent trading volumes favor calls over puts by a narrow margin, and the open interest features 3.5 million calls compared to 3 million puts. While a first look at these figures appears bullish, a further analysis provides key details.
For Jan. 28, the next weekly expiration date for options, the highest open interest is on the $170 calls, with 49,000. This option represents 6% upside to the current share price of Apple stock and is greater than the 5.2% implied move based on at-the-money option straddle pricing.
The option outlook becomes a bit clearer when considering implied volatility. There has been a significant increase of out-of-the-money calls and puts. However, while open interest for out-of-the-money calls is rising, implied volatility for these options is falling, indicating that traders are selling positions in these options. Conversely, open interest and implied volatility for out-of-the-money puts is rising, indicating that traders are buying positions in these options. With elevated premiums ahead of earnings and downside puts remaining more expensive than upside calls, it's telling that traders are more willing to buy these puts while selling calls.
The chart below illustrates at-the-money options expiring Feb. 18, highlighted by the solid green and red boxes. The green box represents the pricing that call option sellers are offering, and it implies a 35% probability that Apple shares will close inside this range by expiration. The red box illustrates the pricing for puts, with a 33% chance if prices go lower by expiration. The probability percentages are based on the current delta of each individual option.
Wrapping Up
Since the start of 2022, the Apple share price has reversed its upward trend to the downside, with the stock having fallen to an extreme low of the volatility range. Option traders appear to be taking the opportunity to sell call options ahead of earnings while the option premium is at its highest, while traders are also willing to pay these elevated premium prices to buy downside puts. This reflects an overall bearish sentiment toward the Apple share price ahead of earnings.
Key Takeaways
- The share price of Apple remains in a relative downward trend ahead of earnings.
- The open interest appears bullish at first glance but has some bearish qualities upon further inspection.
- The Apple share price is trading well below its 20-day moving average.
- Put options remain priced higher than calls.
- Historical volatility-based support and resistance levels allow for a larger move to the upside.