What Impeachment Could Mean for the Stock Market

By Mark Hulbert, TheStreet.com
Investors with long memories have every right to be afraid of what President Donald Trump’s impeachment could do to the stock market.
That’s because impeachment proceedings against Richard Nixon and Bill Clinton were each associated with an equity bear market. In Nixon’s case, the S&P 500 fell 23.7% from the date of the Watergate break-in in 1972 to the day he resigned in August 1974.
The bear market in Clinton’s case was shorter-lived, at least according to the bear market calendar maintained by Ned Davis Research. That decline lasted for six weeks between mid-July and the end of August of 1998, during which the S&P 500, on an intraday basis, fell 21.0%.
During that six-week period, the historians among you will recall, the investigation into Clinton’s relationship with Monica Lewinsky went into full gear. Clinton was served with a subpoena during that time, for example, and he became the first sitting president to testify before a grand jury investigating his conduct.
Investors harboring this concern about the impeachment proceedings against Trump must think that the current stock market is in denial. Far from falling as impeachment hearings have progressed against the president, the major stock market averages have rallied to new highs. On Tuesday of this week, for example, as formal articles of impeachment were introduced, the S&P 500 only fell by a miniscule 3.4 points, or 0.1%.
What’s going on?
To gain insight, I turned to a novel statistical approach that takes advantage of the electronic betting websites that allow you to bet on almost anything -- including a contract keyed to whether Trump will finish out his first term. This contract is priced in all-or-nothing terms, which means its price reflects the probability that he will complete his term. Its current probability, based on the latest price at the site PredictIt.org, is 81%.
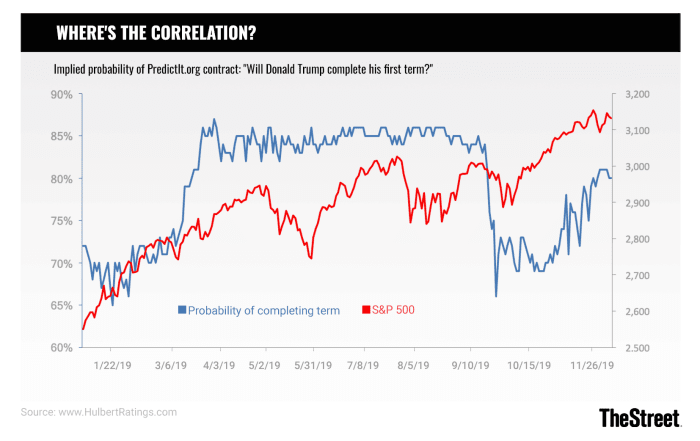
Note carefully that this contract keys off whether Trump is actually removed from office, which is different than whether or not he is impeached. The accompanying chart shows the price history of this PredictIt.org contract since January, when it first began trading. Notice that its trading range since then has been from a low of 65% probability to a high of 87%.
To an untrained eye, of course, it might look as though there is a meaningful correlation between the PredictIt contract and the S&P 500. That contract did fall markedly in late September and early October, for example, in the immediate wake of the whistleblower’s complaint that set the whole impeachment drama in motion. And the S&P 500 also fell.
But notice also that the S&P 500 declined by a similar amount in May as well as in late July/early August, and during neither of those two periods did the PredictIt contract make a major move.
Fortunately, we can be more rigorous than simply eyeballing the data. We can instead calculate the correlation coefficient between changes in the odds of Trump remaining in office through his first term and changes in the S&P 500. I calculated three different correlation coefficients: One that focused on changes over the trailing trading session, another on the trailing week, and the third on the trailing month.
I came up with nothing that would help investors trade the stock market based on the odds of Donald Trump being removed from office. One set of results that shows how little those odds help a trader is that the correlations were not always consistent: In some periods, heightened odds of impeachment were associated with higher stock prices, but in other periods, with lower stock prices. Overall, changes in the impeachment contract price could explain next to none of the corresponding changes in the S&P 500.
I also looked to see if the coefficients became stronger since late September, which was when the whistleblower’s complaint became public and impeachment proceedings on Capitol Hill took center stage. Once again there were no consistent results; correlations became stronger than they were before September when calculated based on a trailing period of one length but weaker when calculated based on a period of different length.
The bottom line? Whether you take these results to be good or bad news depends on whether you’re bullish or bearish on the stock market -- and your politics. You of course can continue to predict what you think the stock market will do if and when the odds of President Trump being removed from office rise or fall markedly from current levels.
You just can’t base your prediction on how the stock market has reacted over the last year to changes in those odds.
From TheStreet