What Are Bollinger Bands and How Are They Used?
The Basics Of Bollinger Bands
Bollinger Bands are a technical analysis tool that envelop a chart of a stock or an index as a means of defining a plausible volatility boundary for the instrument in question.
Plotted above and below the chart of the index or stock in question, Bollinger Bands are more responsive than a moving average envelope, but less responsive than Price Headley's proprietary Acceleration Bands. Unlike a moving average envelope -- which is calculated as a percent amount above and below a moving average line -- Bollinger Bands are plotted by the addition and subtraction of a standard deviation calculation from a moving average line... usually a simple moving average. Generally speaking, 90% of the chart's total movement will happen within the confines of Bollinger Bands.
Bollinger Bands are useful largely because they are adaptive to volatility, diverging as a chart starts to move higher or lower at a faster pace than usual, and converging as volatility is reeled in.
As for how Bollinger Bands are used by a traders, there are two approaches.
More often than not a Bollinger Band acts as support or resistance sooner than later, reversing a move. Some of the time, however, a Bollinger Band will fail to contain a bearish or bullish thrust. In those instances, a move outside of the envelope established by Bollinger Bands can indicate a trade-worthy move is underway.
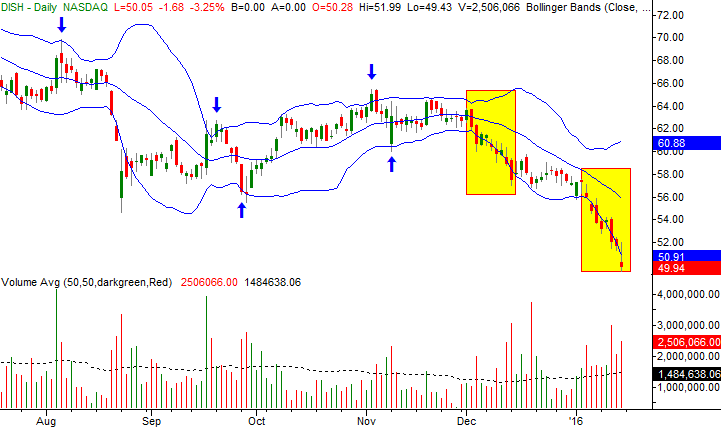
An example will better illustrate how Bollinger Bands are best utilized. On the chart of DISH Network (DISH) below, early on in that timeframe in question an encounter with the upper as well as the lower Bollinger Bands (20-day moving average line, 2 standard deviations) led to a reversal. Later on in the period in question, once DISH broke under the lower Bollinger Band and made two lower closes underneath the lower band line, a strong pullback developed.
DISH Daily Chart
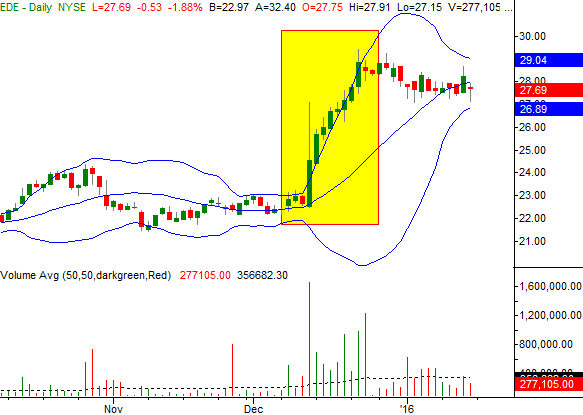
Bollinger Bands can be just as effective at spotting bullish breakouts. On our chart of Empire District Electric (EDE) below, once the stock thrust firmly above the upper band line it didn't even look back until nearly two weeks later, rising nearly five points in the meantime.
EDE Daily Chart

Point being, while Bollinger Bands are mathematically more akin to an oscillator (or a tool for spotting reversals), they can and do serve as much purpose as a momentum indicator. In fact, though it was mentioned above that approximately 90% of a stock's or index's price action will be contained within the envelope established by Bollinger Bands, more often than not the most trade-worthy movement is that rare action above and below the band lines.
The formula for the most-commonly-used 20-day Bollinger Bands:
- Midline = 20-day simple moving average (SMA)
- Upper Band = 20-day SMA + (20-day standard deviation of price x 2)
- Lower Band = 20-day SMA - (20-day standard deviation of price x 2)
Traders can adjust the length of the moving average used to calculate Bollinger Band values as well as tweak the number of standard deviations used in the calculation.