
Weekly Market Outlook – This Rally’s Missing One Key Ingredient

Following through on the previous week’s bullishness, stocks mustered another wobbly gain last week. Momentum-wise, in fact, it looks like the rally is picking up steam again.
There’s just one serious problem with the effort so far… plus another (potential) smaller one.
We’ll look at them in a moment. First, let’s review last week’s biggest economic announcements and preview what’s coming this week.
Economic Data Analysis
There really wasn’t a lot reported last week. The first big news came on Monday, from the Institute of Supply Management. The services index for June fell just a bit, but is still well into positive territory at 54.0. This report rounds out the ISM’s manufacturing index update for June released a week earlier, which also showed a slight slide from a very strong May figure. On balance, this data still says the economy is doing well, which bodes well for corporate earnings.
ISM Services, Manufacturing Index Charts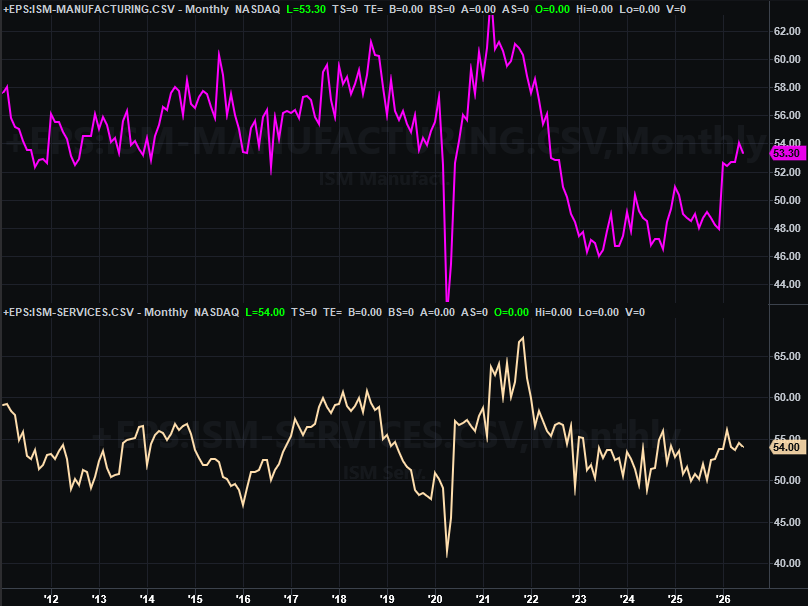
Source: Institute of Supply Management, TradeStation
The only other item of any real interest posted last week was June’s sales of existing homes, on Thursday. They fell a bit, although only back to the same low level seen as of late-2022 when the pandemic finally ground purchase activity to a halt. Meanwhile, as the image below shows, May’s sales of existing homes fell to a multi-year low as well.
Home Sales Charts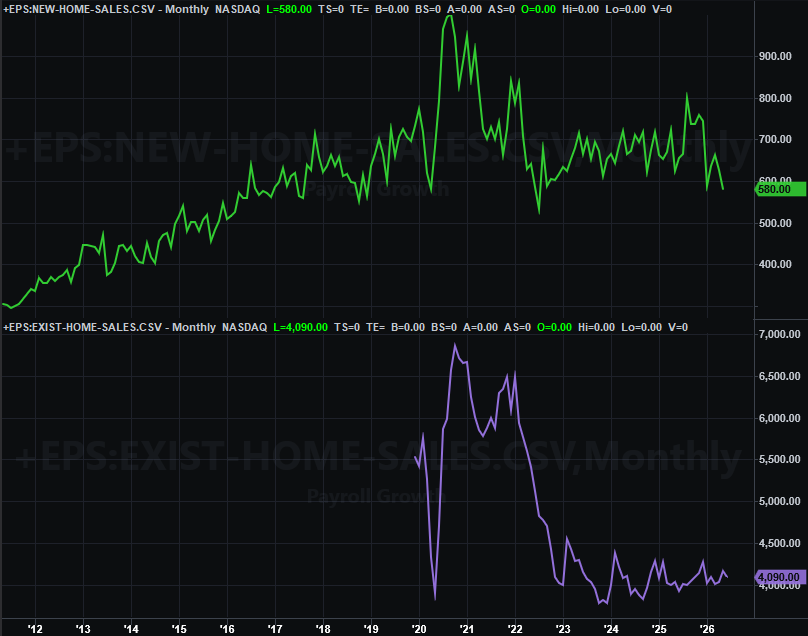
Source: National Association of Realtors, Census Bureau, TradeStation
It’s no big secret why this is happening. As National Association of Realtors also pointed out with its existing home sales report, these homes’ prices also moved to record average level of $440,600, pushing well past the envelope of affordability for most would-be buyers.
Last month’s new home sales data from the Census Bureau isn’t going to be posted until the week after this one, although it’s unlikely to look much different. Everything else is on the grid.
Economic Data Report Calendar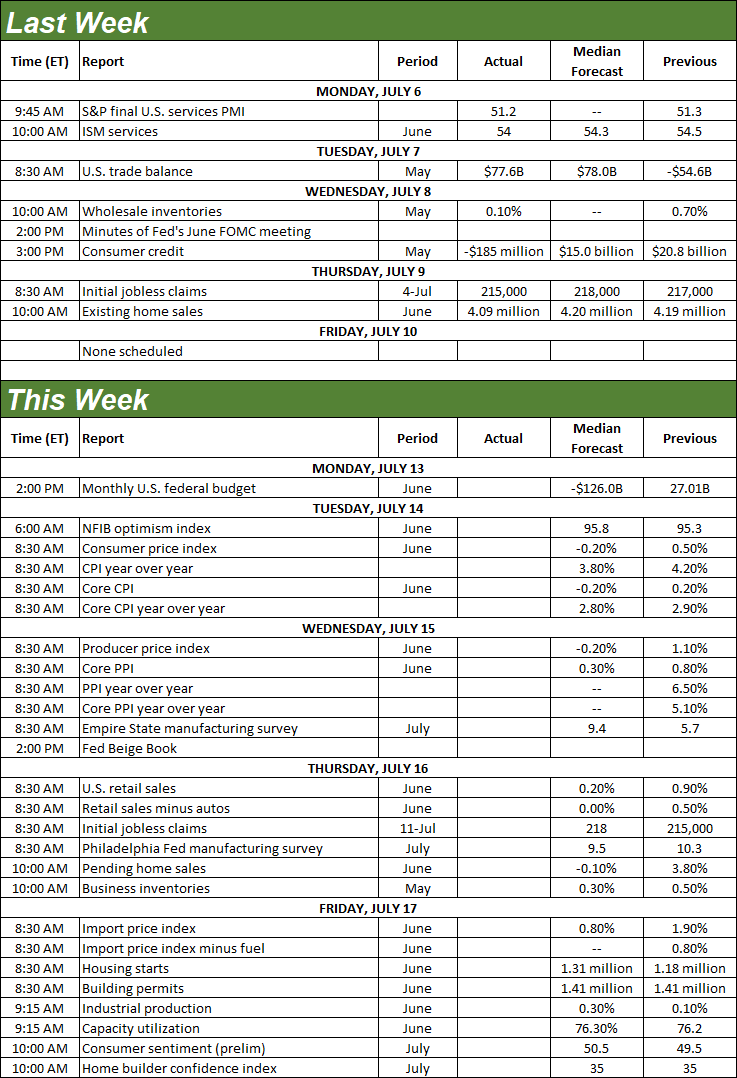
Source: Briefing.com, TradeStation
This week’s going to be a doozie. The party starts in earnest on Tuesday with last month’s consumer inflation data, with June’s producer inflation report due on Wednesday. Economists are looking for a slight cooling this time around, but inflation rates should still remain elevated, leaving the Federal Reserve little choice but to at least leave interest rates alone. And, a rate hike in the foreseeable future still isn’t off the table.
Consumer, Producer Inflation Rate (Annualized) Charts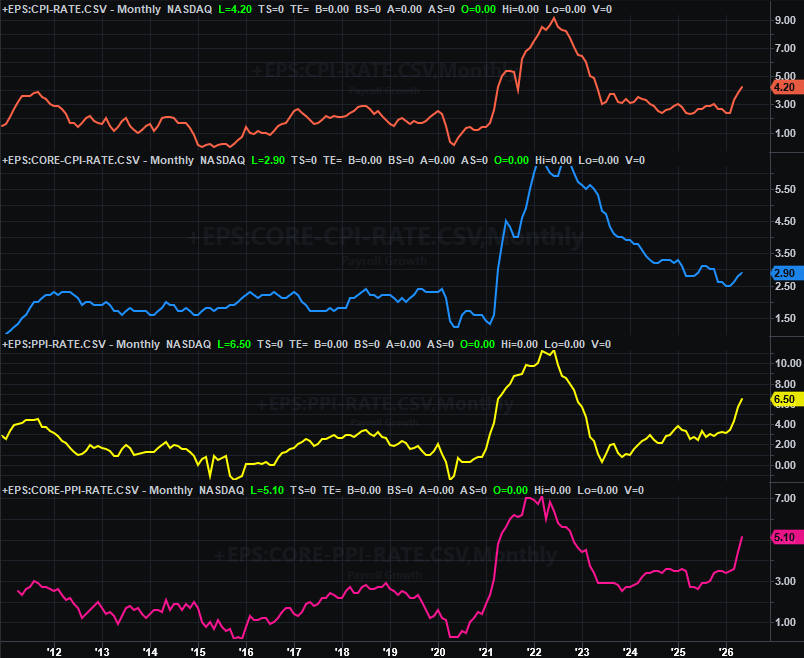
Source: Bureau of Labor Statistics, TradeStation
June’s retail sales will be posted on Wednesday. Forecasts are calling for only modest growth, cooling from May’s acceleration.
Retail Sales Charts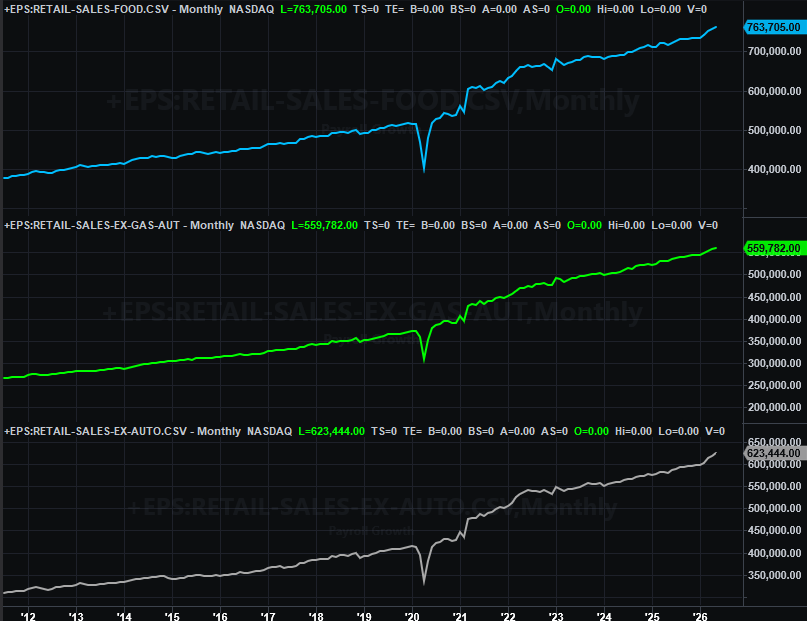
Source: Census Bureau, TradeStation
On Friday look for last month’s housing starts and building permits from the Census Bureau as well, further fleshing out the real estate picture. As the graphic below shows, permits remain tepid, while actual starts fell to a multi-year low… nothing completely surprising given the recent weakness in purchases. Forecasters aren’t calling for any real progress this time around.
Housing Starts, Building Permits Charts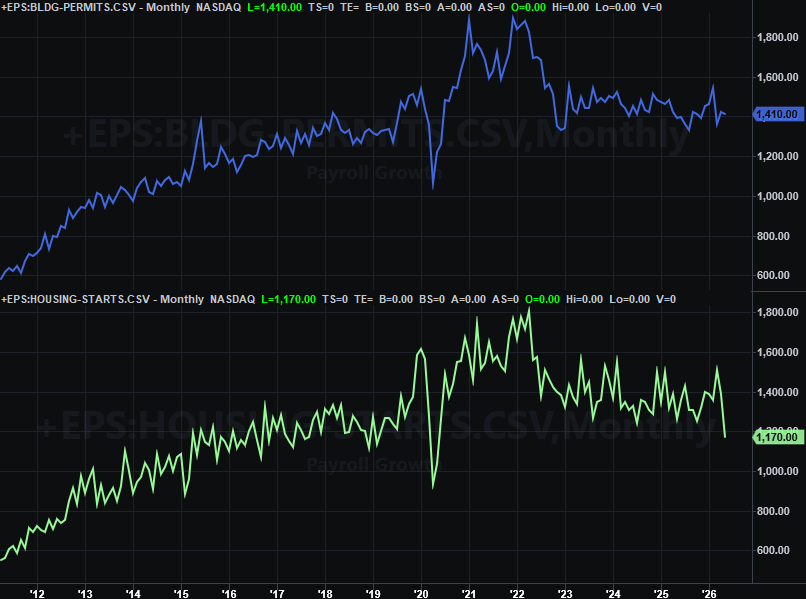
Source: Census Bureau, TradeStation
Finally, also on Friday we’ll hear about last month’s capacity utilization and industrial productivity from the Federal Reserve. Economists believe we’ll improve on May’s already-improving numbers.
Capacity Utilization, Industrial Production Charts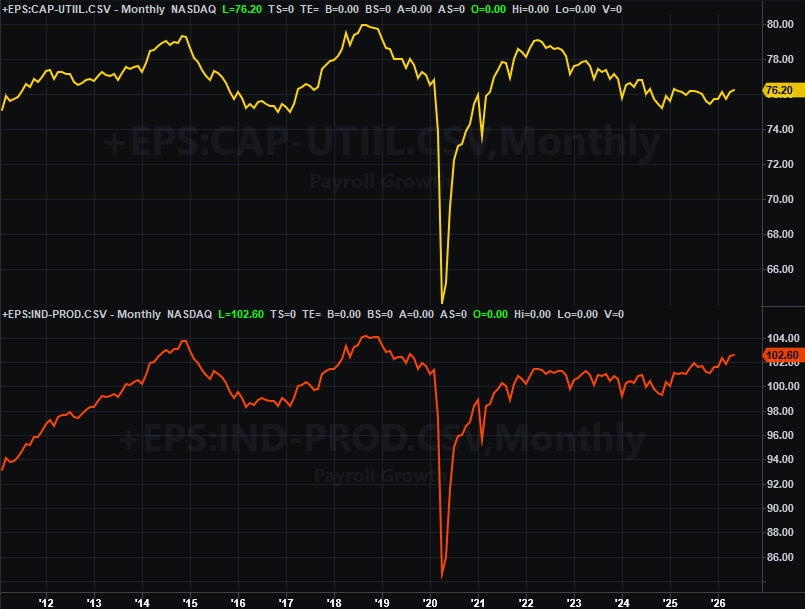
Source: Federal Reserve, TradeStation
This is good news, even when there’s little of it on other fronts. The correlation between corporate earnings – and therefore the market’s long-term performance – is quite high, even if it has no bearing on the market’s near-term ebb and flow.
Stock Market Index Analysis
We start this week’s analysis with a look at the weekly chart of the NASDAQ Composite, not because we have the most to say about it (we actually have the least to say about this chart), but because this look sums last week up so simply. That is, for a second week in a row the market made bullish progress, taking another small bite out of the bigger pullback suffered since early June.
NASDAQ Composite Weekly Chart, with MACD and VXN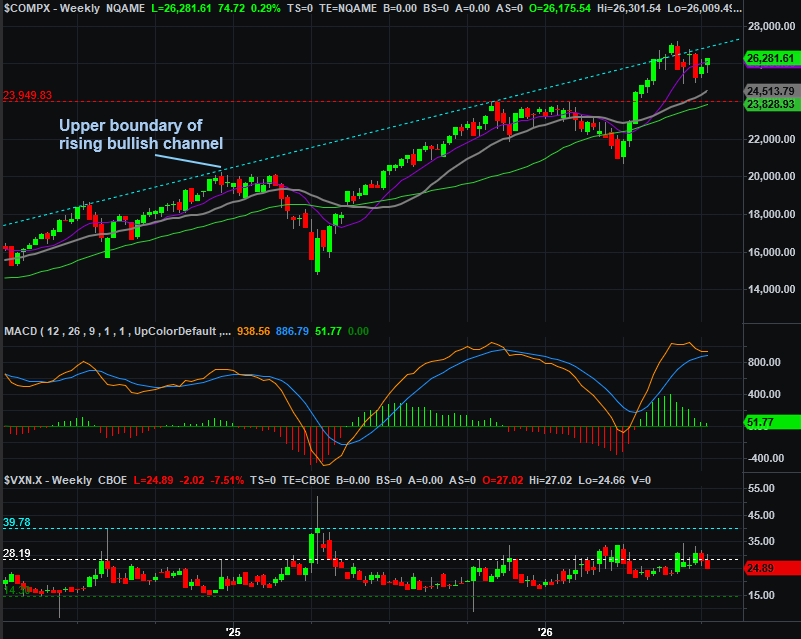
Source: TradeNavigator
The daily chart of the NASDAQ shows us something else that’s at least a little bit encouraging. That’s the fact that the composite appears to have pushed up and off of a rising support line (white, dashed) that extends all the way back to March’s low to punch through the falling resistance line (purple, dashed) that had been steering the composite lower since its early June high. That’s a reasonably big deal, bolstered by the fact that the 20-day (blue) and 50-day (purple) moving average lines are both now sloped upward again. That’s a modest indication that the overall momentum here is indeed bullish.
NASDAQ Composite Daily Chart, with Volume and VXN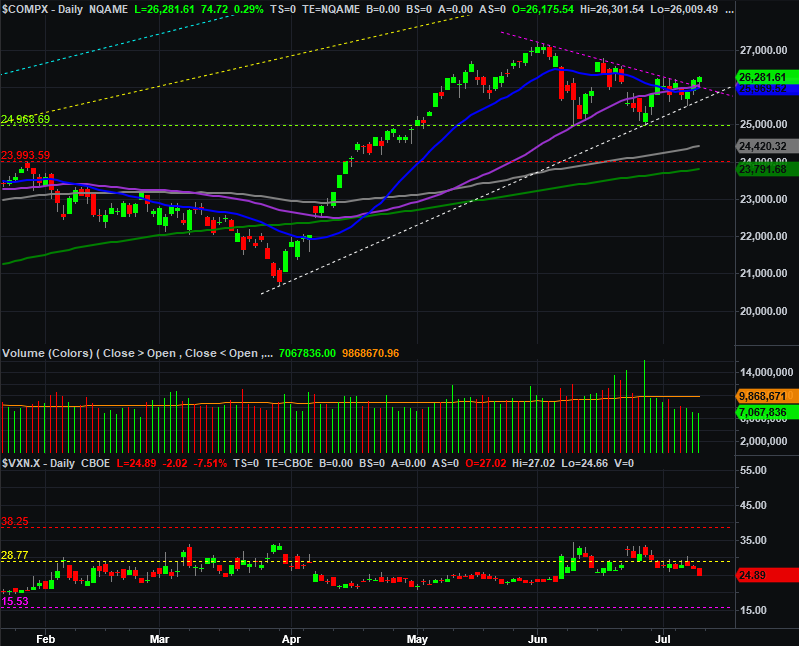
Source: TradeNavigator
The only problem? There’s very little volume behind this recovery effort, and less and less of it as the NASDAQ inches its way higher. If this advance is going to last, it needs to gain participation on the way up.
The S&P 500 has the same problem. As the daily chart below illustrates, it was able to push up and off of its 50-day moving average line (purple, circled) to end the week on a high note. It didn’t clear the previous peak at 7,578 though (green, dashed), and as wat noted, the volume behind the advance is increasingly anemic.
S&P 500 Daily Chart, with Volume and VIX 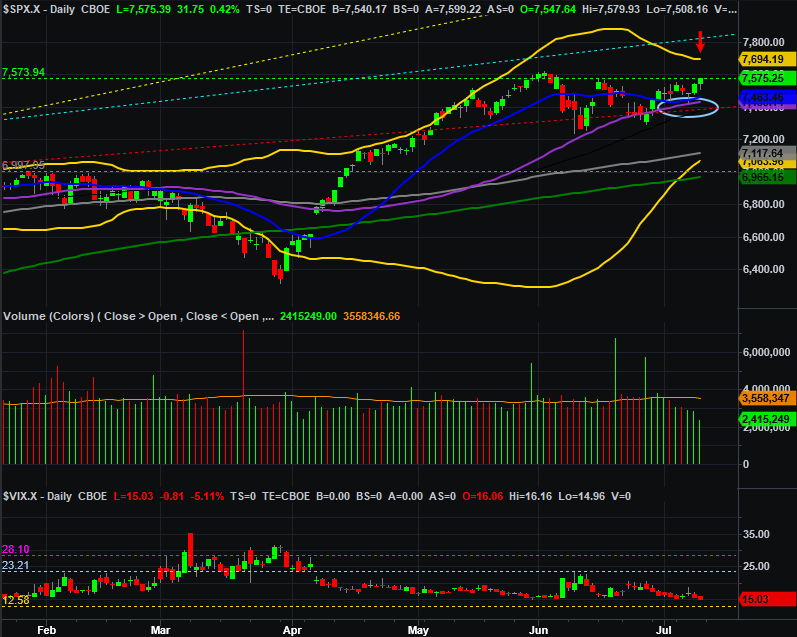
Source: TradeNavigator
That’s not the spot on the daily chart of the S&P 500 that we’re watching though. Far more interesting at this point is the fact that the upper Bollinger band (yellow, marked with a red arrow) at 7,694 is moving back into position as a potential ceiling. The index would obviously need to punch through its resistance at 7,578 first, but that would be an ideal place for the bears to make their stand…
… spot made more ideal by the fact that the weekly chart’s long-term technical ceiling – the one that connects most of the peaks going all the way back to 2023 – is also waiting right around there (marked with a red arrow on the chart below). By the time these technical ceilings are bumped into, the S&P 500’s volatility index (VIX) could be near an absolute low around 13.0 (yellow, dashed). That’s doesn’t have to mean the market’s ready to pull back. But, it certainly deflates much of the bullish argument.
S&P 500 Weekly Chart, with MACD and VIX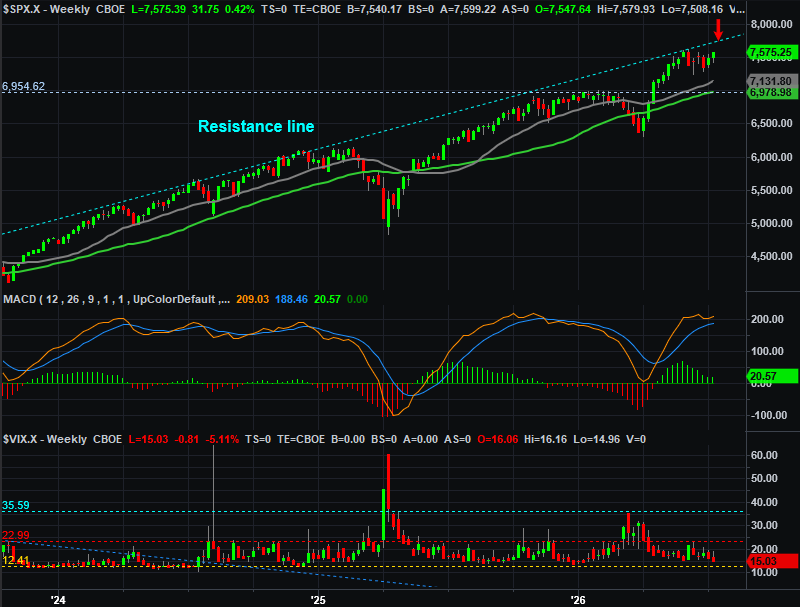
Source: TradeNavigator
Those are the concerns anyway. It’s also possible the market could simply continue drifting higher from here, moving right past these technical ceilings. In fact, until there’s clear proof that stocks aren’t ready to do so -- in the form of a break back beneath the 50-day moving averages – we have to assume the current bullish momentum will carry on (as unlikely as that seems like it should be here).