Weekly Market Outlook - This Oddly Persistent Rally Isn't Unheard Of
Friday's mid-day lull ended up making the day a wash, but even then, the market logged another weekly gain. The S&P 500 advanced 0.6% for the five-day stretch, which isn't much, but bear in mind there was only three and a half days' worth of trading last week. Moreover, with the Christmas break falling right in the middle of the week, traders effectively made things a very long weekend.
Still, with eleven of the past twelve weeks being winners, the market is uncomfortably overbought. Last week's strength looks and feels a little artificial, as if investors wanted to ensure we got the typical Santa Claus rally.
This week will be equally wonky, with New Years Day also falling on Wednesday. Take everything with a grain of salt, and don't forget that no matter what, we have to start this week where we ended last week (for better or worse). And, we have to start next week where we finish this week... which will probably still be in an overbought condition. Don't get too enamored by the calendar, or calendar-based tendencies.
We'll explore the details below, after looking at last week's economic news and previewing this week's economic announcements.
Economic Data Analysis
A very light week last week in terms of economic news, thanks to the way the holiday break fell. In fact, there was only one item we bothered previewing a week ago... last month's new home sales. The pros were calling for an annualized pace of 735,000, but they only came in at 719,000. Still, that's more than October's 710,000, and extends a wave of renewed strength we've seen on the real estate front. Also, be aware that a lack of inventory may be limiting purchase activity to a small degree.
New, Existing Home Sales Charts
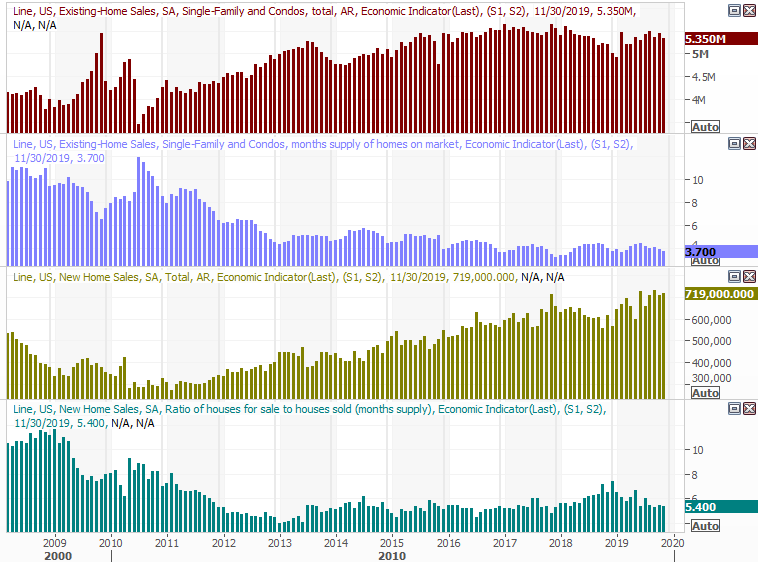
Source: Thomson Reuters Eikon
It's not a data set we look at all that often, but given how much time and room we have here, below is an update of the United States natural gas and crude oil stockpile (excluding the government's strategic reserves). Natural gas is being depleted, as is always the case as we move into winter. But, the falling levels of crude oil inventory isn't a cyclical matter. The September-November growth was quelled before it got going in earnest. This works to buoy crude oil prices.
Natural Gas, Crude Oil Stockpile Charts

Source: Thomson Reuters Eikon
Everything else is on the grid.
Economic Calendar
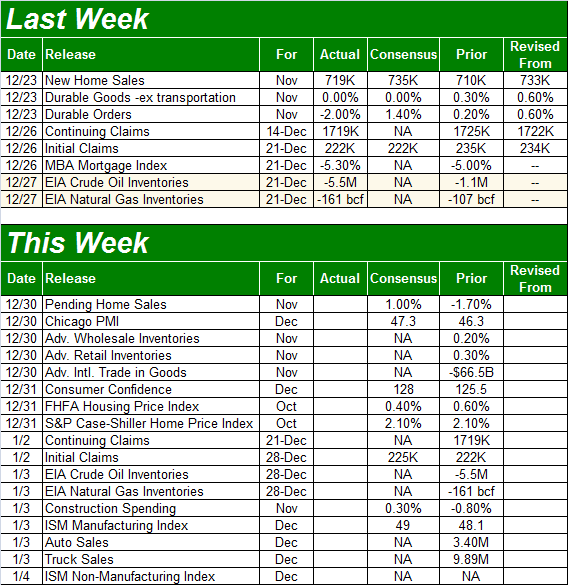
Source: Briefing.com
This week will be a little busier, with more hard-hitting items. Chief among the most noteworthy announcements will be December's automobile sales (on Friday), and Tuesday's home price update (which will round out last week's update on home purchases).
But, first things first. On Tuesday we'll get December's consumer confidence score from the Conference Board. Economists are calling for a healthy improvement, mirroring the improvement we've seen thus far with the Michigan Sentiment Index reading. Notice that while optimism hasn't improved in over a year, it's not slumped either despite plenty of concerning headlines. It may be that confidence is 'maxed out,' and won't rise any further from here regardless of circumstances.
Consumer Sentiment Charts
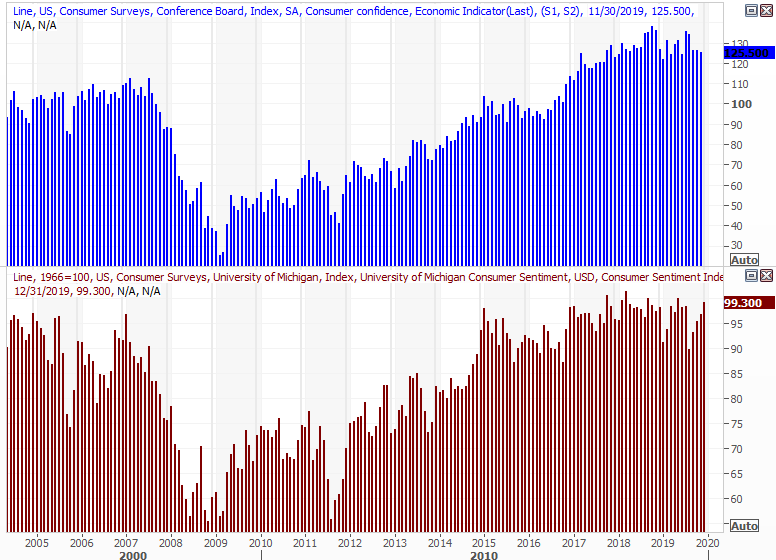
Source: Thomson Reuters Eikon
Also on Tuesday we'll get an update on housing prices. You'll recall both the Case-Shiller Index and the FHFA Housing Price Index have been slowing of late, but perked up again in September. The October updates are supposed to show renewed strength as well, jibing with healthy (but not overheated) purchases.
Home Price Charts
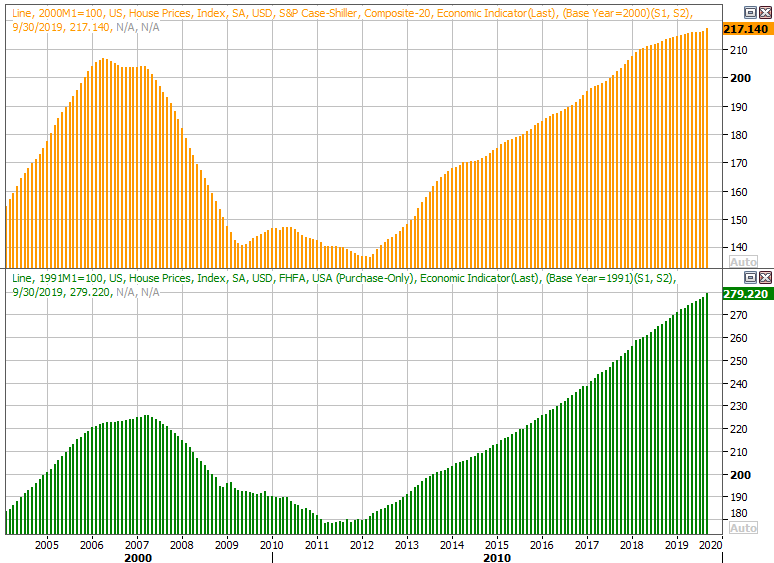
Source: Thomson Reuters Eikon
Finally, though 'peak auto' happened in 2015, we've not actually seen a dramatic lull in the meantime... just a leveling off of that pace. But, another weak (lower, sequentially) reading might force a reconsideration of that observation. That's particularly true given how strong consumer sentiment and incomes -- and home buying -- still is.
Auto Sales Charts
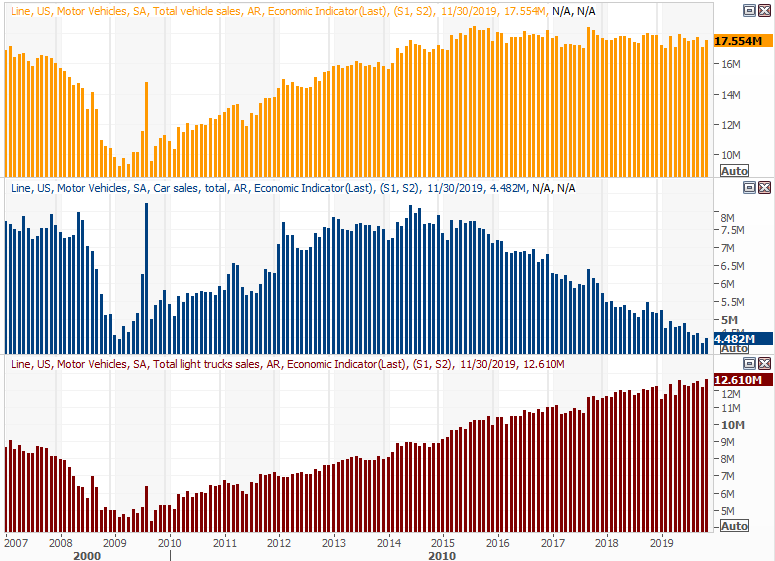
Source: Thomson Reuters Eikon
Stock Market Index Analysis
This week's analysis once again starts with the bigger-picture weekly chart of the S&P 500, just to set the stage appropriately. Thanks to last week's 0.6% advance, the index is now up nearly 10% from its October low. We've seen more meteoric, unfettered rallies, but they're a rarity. And, just for the record, the S&P 500 is now 8.8% above its 200-day moving average line (white). That's somewhere around the very extreme end of its typical divergence. In early 2018, the index reached 13.3% above its 200-day line, but that was an even more extreme scenario in that 2017's rally was also uninterrupted for so long.
S&P 500 Weekly Chart, with VIX and RSI
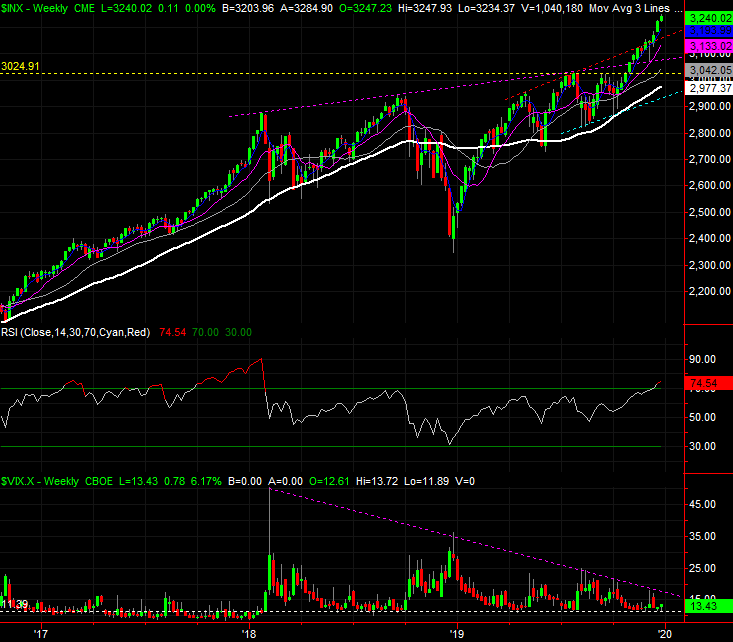
Source: TradeStation
Still, it's that 2017 rally that should serve as a reminder that anything's possible. The market doesn't "feel right," but how things feel isn't exactly the point. Follow the momentum until it's clear the momentum has reversed course.
To that end, we're still looking for one of two (if not both) clues that the tide has truly taken a bearish turn. One of them is a move below the 20-day moving average line at 3170, plotted in blue on the daily chart below. The other is still the VIX breaking above the falling resistance line that's guided it lower since it peaked in early 2018. That ceiling is plotted in purple on both charts.
S&P 500 Daily Chart, with VIX and Volume

Source: TradeStation
Just for good measure, a look at the weekly chart of the NASDAQ Composite, and the VXN. Curiously, it's now trading 10.7% above its 200-day moving average line, versus its early-2018 divergence of 13.2%. Never say never, particularly when we're transitioning into a new year. Sometimes investors have some preconceived notions in their heads that they're going to ensure pan out, whether or not they make sense.
NASDAQ Composite Weekly Chart, with VXN
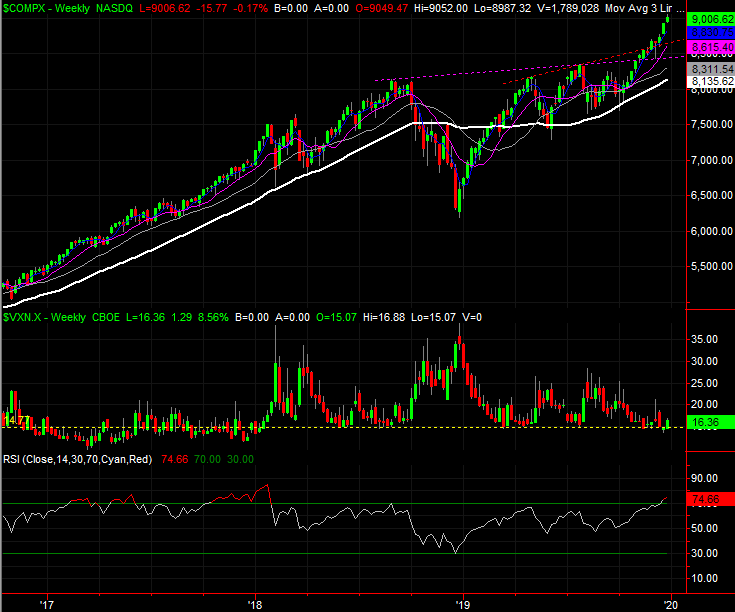
Source: TradeStation
Of course, it never hurts to be prepared for a sharp reversal. We know one is coming sooner or later. The same basic red flags that apply to the S&P 500 apply to the NASDAQ as well.
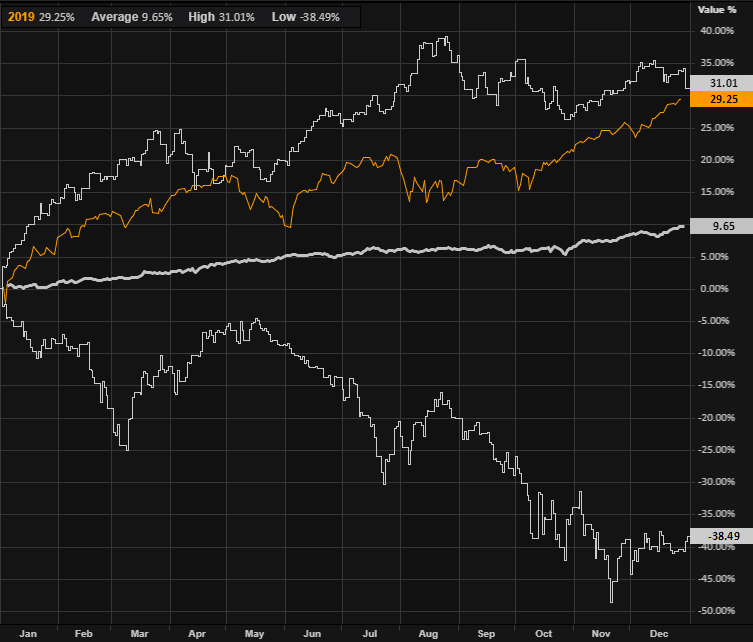
With all of that being said, the year may not be technically over yet, but practically, it is. It's time to take a look back and see how it took shape. As they say, read 'em and weep. The image below tells the tale. Thanks to a harrowing end to 2018 setting up a fairly easy rebound rally in 2019, the S&P 500 managed to dish out a 29.2% gain for the now-ending calendar year. That's one of the best for the past forty years.
S&P 500 Progressive Annual Performance vs. Average
Source: Thomson Reuters
On that note, be aware that January is usually a bullish month, and does particularly well early in the month. We already know there's room for more upside. Just be careful about assuming history repeats itself. On the flipside, don't ignore historical tendencies. Whatever's in the cards, just keep in mind that the beginning of a new year will lead traders to conclusions that may or may not be merited. Tread lightly.