
Weekly Market Outlook – Momentum Generates More Momentum. Here’s the Only Worry.

Picking up where they left off a week ago, the bulls drove stocks to yet-another record high. It wasn’t a thrilling move. All told, the S&P 500 advanced another 1.5%. In light of the huge runup from April’s low though, any further gains from here are impressive. There’s also room for more upside, and more reason to expect it.
There’s also legitimate worry though.
We’ll weigh what’s going right and what could go wrong in a moment. Let’s first look at last week’s economic reports and preview all that’s coming this week. In light of what we heard, it’s a bit surprising stocks were able to keep on trucking higher like they did.
Economic Data Analysis
We only got two pieces of noteworthy information last week, and they were actually (very) related. Last month’s sales of existing homes were reported on Wednesday, while June’s new home sales data was released on Thursday. Both came in a bit lower than anticipated, and existing homes sales actually fell from May’s number (new-home sales edged up just a bit). More than anything though, both measures remain near their multiyear lows seen once the pandemic-driven buying frenzy finally cooled off.
New, Existing Home Sales Charts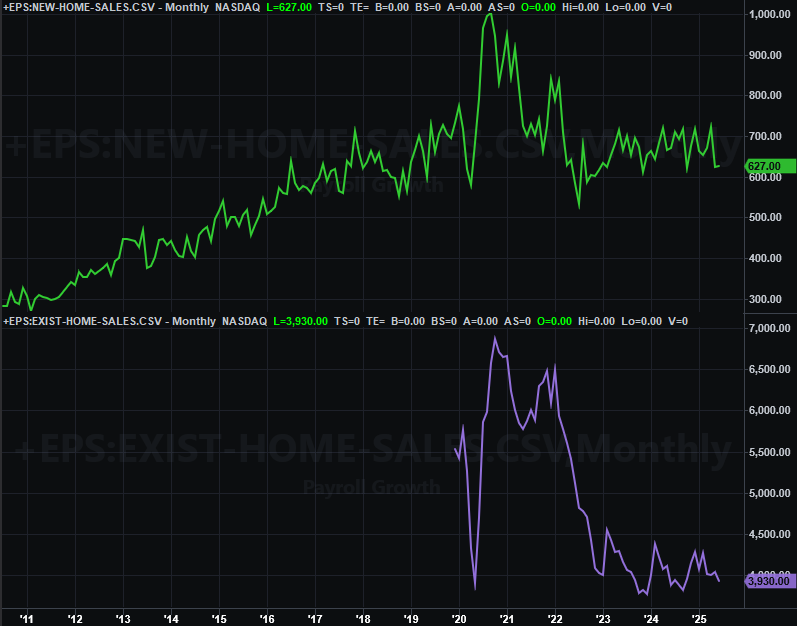
Source: Census Bureau, National Assn. of Realtors, TradeStation
Yes, this is bad news… at least for the real estate market. The good news is, there’s actually a lot of distinction between the housing market and the stock market and the jobs market right now. It’s not fatal for the overall economy that real estate is hitting a wall.
Everything else is on the grid.
Economic Data Report Calendar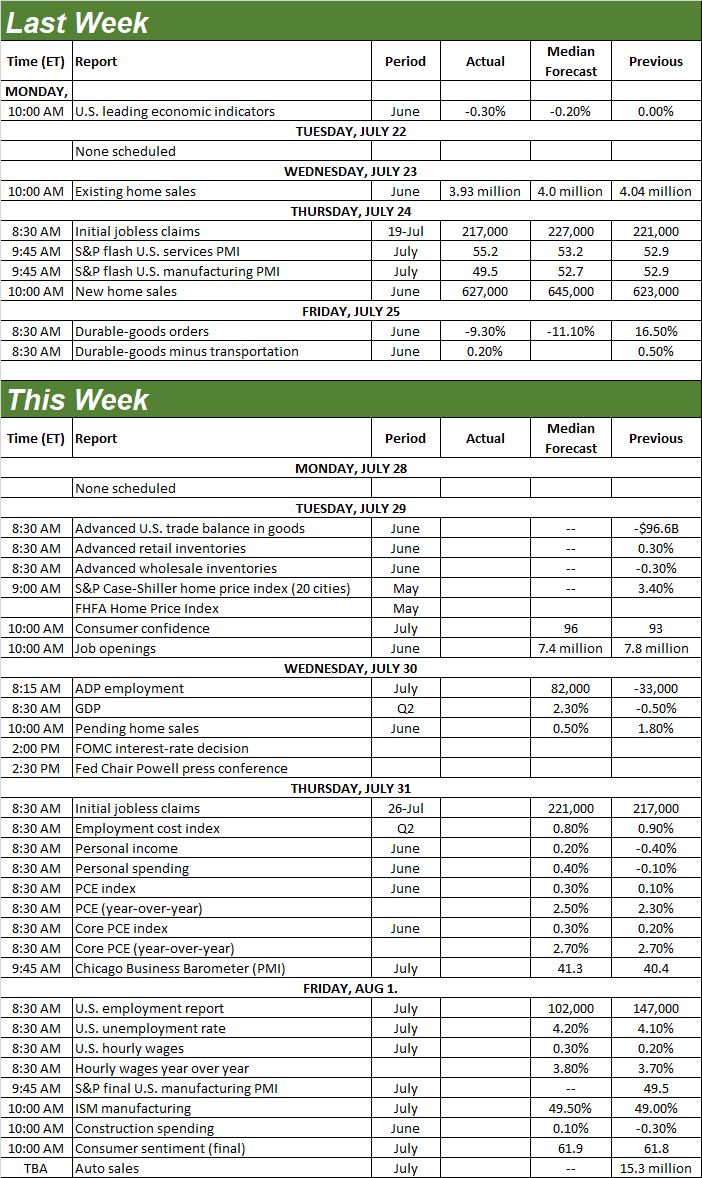
Source: Briefing.com, TradeStation
This week is going to be downright wild, with much of the wave of data in the lineup also having the potential to move the market.
The party starts in earnest on Tuesday with a look at the most recent home-pricing data. That’s the Case-Shiller Index and the FHFA Home Price Index. Although both are only for May, this will still help us get a handle on what’s happening here. As you can see, the Case-Shiller Index continues to break records, while the FHFA measure seems to have peaked. This could be a sign that the lower end of the housing market is losing its pricing power, while the higher end isn’t.
Home Price Charts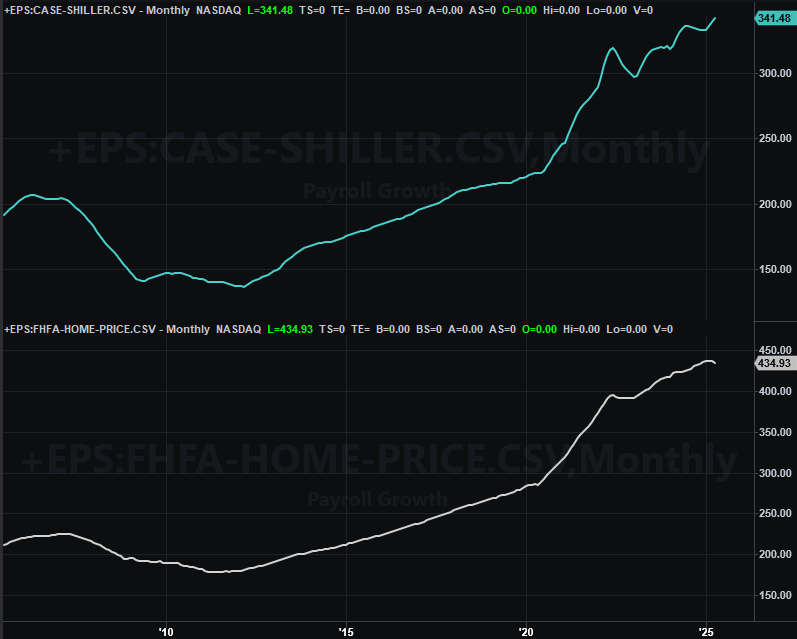
Source: Standard & Poor’s, FHFA, TradeStation
Just bear in mind that there’s still a strangely big disconnect between home prices and actual home sales. While fewer houses are transacting, sellers still seem to be getting the price they want.
It’s also a big week for consumer sentiment. The Conference Board’s confidence number for July will be released on Tuesday, and should tick higher. Meanwhile, the third-and-final sentiment score from the University of Michigan will be posted on Friday, and should also show a little improvement. Both will still be at relatively low levels though.
Consumer Sentiment Charts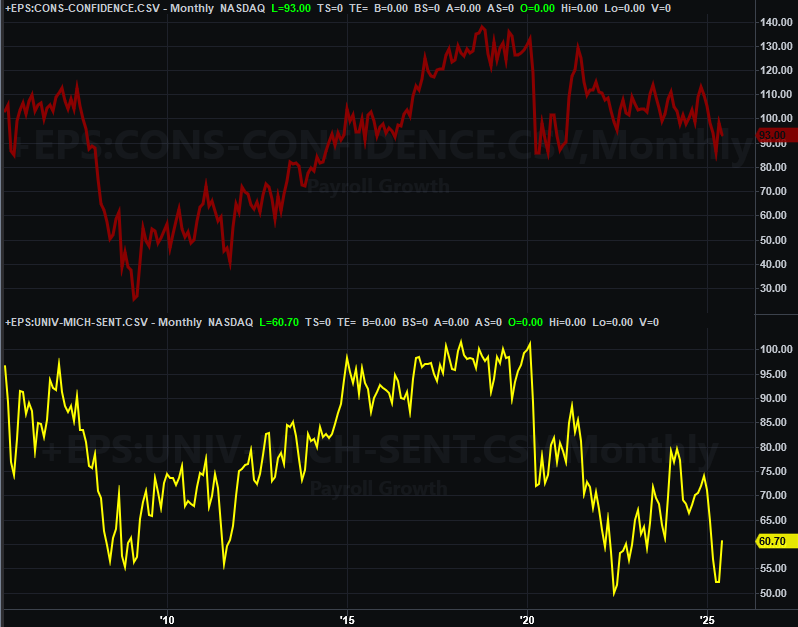
Source: Standard & Poor’s, FHFA, TradeStation
The only possible positive spin to put on consumer confidence here is that it could be interpreted in a bullish/contrarian light. But, there’s not a clear-cut correlation for using this data like that.
Look for last month’s consumer spending and income report for June on Thursday, which is what the Federal Reserve considers first and foremost when making decisions regarding interest rates. The only problem is, the next scheduled time for such a decision is the day before. The market’s betting the Fed won’t cut rates this time around, but is still (mostly) expecting a quarter-point cut in September.
The ISM Manufacturing Survey report for July is due on Friday, but that’s not the biggie coming at the end of the week. We’ll also get July’s jobs report then. Economists believe job growth will slow just enough to push the unemployment up 10 basis points to 4.2%. But, that’s still pretty solid. These forecasts haven’t exactly been on target of late either, tending to underestimating the employment landscape’s actual strength.
Payroll Growth, Unemployment Charts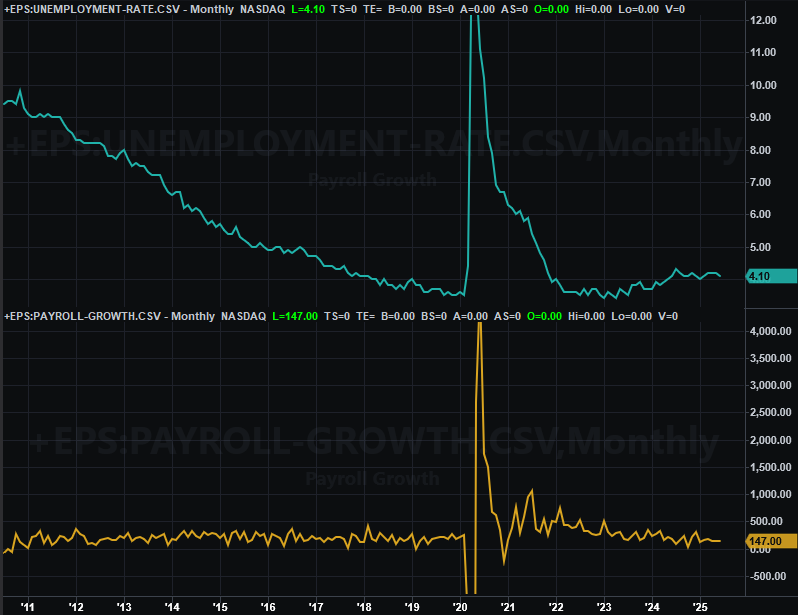
Source: Standard & Poor’s, FHFA, TradeStation
Stock Market Index Analysis
Another week, another win. And this one seems to have re-accelerated the rally that lost some steam over the prior two weeks. In other words, there’s bullish momentum again, which of course produces more of the same. The weekly chart of the S&P 500 below says it all. In addition to faster gains, the index appears to now be fighting its way above the rising resistance line (yellow, dashed) that had been holding the rally back. There’s also plenty of room to keep rising before bumping into the next-possible technical ceiling.
S&P 500 Weekly Chart, with VIX 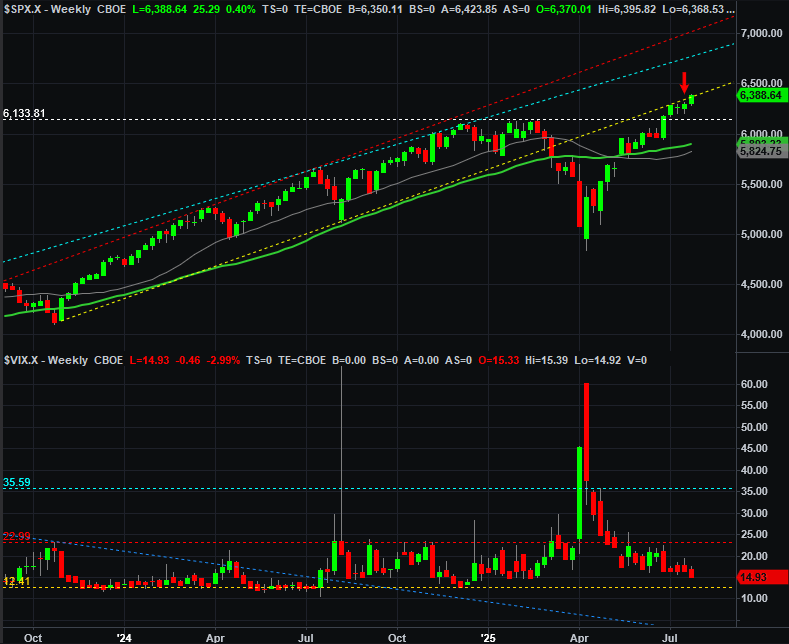
Source: TradeNavigator
It’s not exactly an ideal scenario and backdrop for the bulls though. In addition to the sheer speed and size of the rally from April’s low (32% in 16 weeks) that’s tough to add to, the volatility index -- or VIX -- is nearing a near-absolute floor around 13. The market is capable of continuing to rally in that situation. But, it’s not particularly. It tends to slow things down.
The same can be said of the NASDAQ Composite. As its weekly chart shows us, it’s now above a minor resistance line and has a clear path to the upper boundary of the bullish trading range that framed the bull market between late-2022 and late-2024. But, the NASDAQ’s volatility index (VXN) at the bottom of the weekly chart below is also nearing a low level that tends to make it difficult to continue adding gains. Not impossible, but difficult.
NASDAQ Composite Weekly Chart, with VXN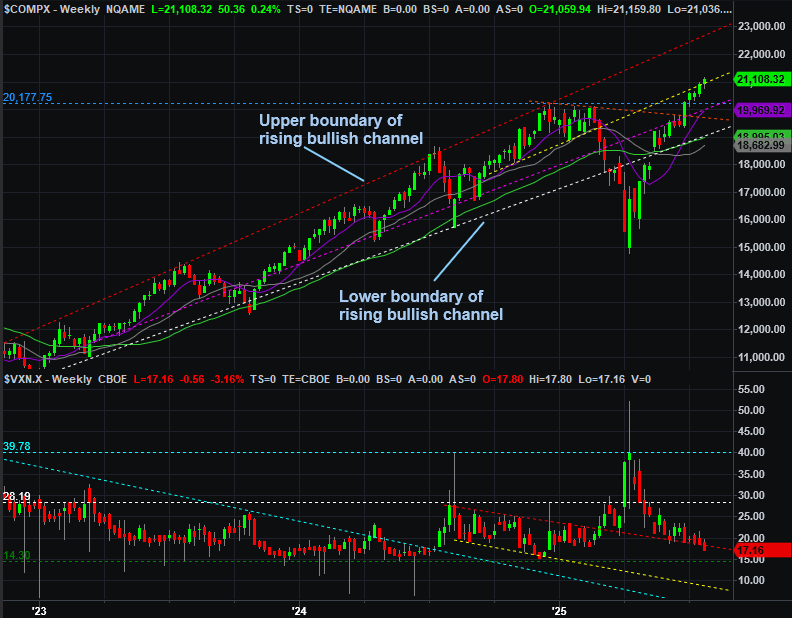
Source: TradeNavigator
Zooming into the daily chart of the NASDAQ Composite paints a bit of a more detailed picture, which remains mostly bullish, but with a footnote. That is, the shape of the daily bars (where several of the recent ones have easily peeled back from their intraday highs) suggests the effort is actually running out of steam as the VXN inches its way lower to its more absolute floor of around 16. The counterargument is, though the composite isn’t exactly charging higher, it’s moving higher on rising volume. The advance is gathering participants on the way up. That’s a subtle bullish clue.
NASDAQ Composite Daily Chart, with Volume and VXN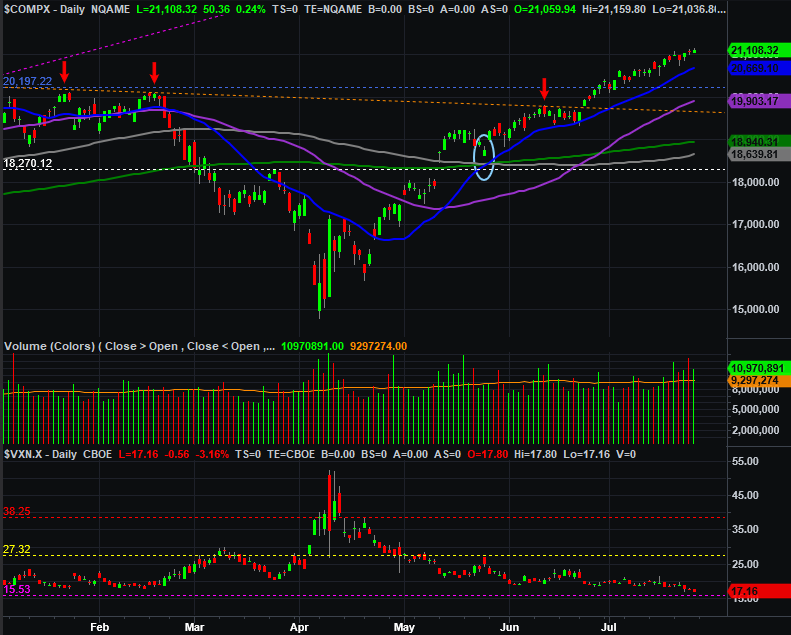
Source: TradeNavigator
The biggest problem right now (again, for the rally)? It’s actually not showing up on any of our charts. It’s the market’s valuation. The S&P 500 is now priced at nearly 25 times its trailing earnings, and 24 times its forward-looking earnings projections. It’s been higher, but not much higher for very long.
Traders are ignoring valuation worries right now. And, perhaps they’ll continue doing so. They won’t -- and can’t -- continue buying stocks at this pace forever though. They’re simply too expensive.
The good news is, there’s a thick layer of technical support for both indexes below their current levels. Pulling back to test one or more them might be a good thing, in fact, giving the rally a breather. It’s also the right time of year for a lull. August and September are usually losing months for the market.
Connect the dots. Although the current momentum is bullish, there’s good reason to expect at least a little bit of a pullback from here.