
Weekly Market Outlook – Every Step Higher is Getting a Little Tougher

The bulls picked up where they left off two weeks back, plowing back into stocks to lead the market to another record high. But, the weight of the recent runup clearly slowing the effort. The NASDAQ’s stocks (laden with growth and technology names) ended up peeling back a bit to close below its intraweek high. Ditto for the S&P 500, albeit not as dramatically.
The S&P 500 did, however, bump into what’s becoming an increasingly-entrenched resistance line. More on this in a moment. For now, let’s just acknowledge that the longer-term bull market effort does indeed seem to be slowing down.
Before getting into any of this though, let’s run through last week’s economic news, and then preview what’s in the lineup for this week.
Economic Data Analysis
Last week’s big economic news was of course July’s inflation figures. As feared, it ticked higher across the board… and more than a little bit. The overall core consumer inflation rate now stands at 3.1%, and while producers’ price increases are manageable, they rolled in a bit more than anticipated.
Consumer, Producer Inflation Rate Charts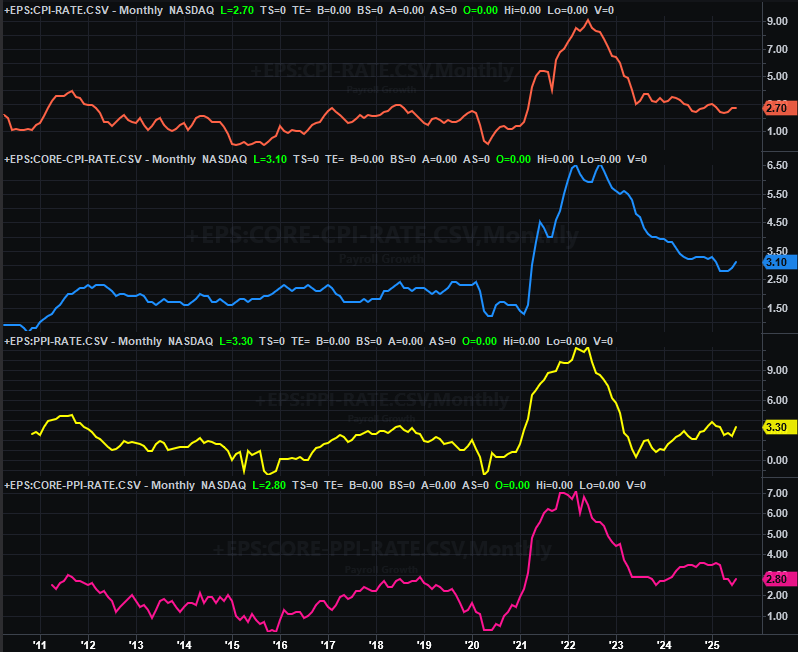
Source: Census Bureau, TradeStation
This of course diminishes the odds of a quarter-point interest rate cut next month, although not by much. The market’s now saying there’s an 85% chance of such a cut.
And it’s not completely crazy bet, given that consumers still seem to be holding up despite higher costs. Last month’s retail spending improved in line with now-well-established trends no matter how you’re measuring it.
Retail Sales Charts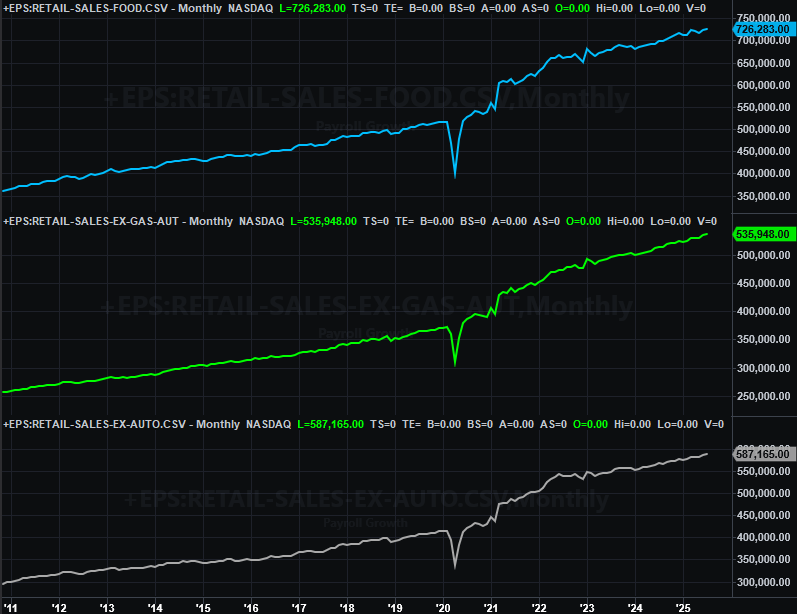
Source: Census Bureau, TradeStation
The actual economy, however, isn’t exactly following suit. Although neither crashed, both capacity utilization and industrial production slipped a little bit in July, with the latter seemingly extending a bigger-picture downtrend that’s been in place since 2022.
Capacity Utilization, Industrial Production Charts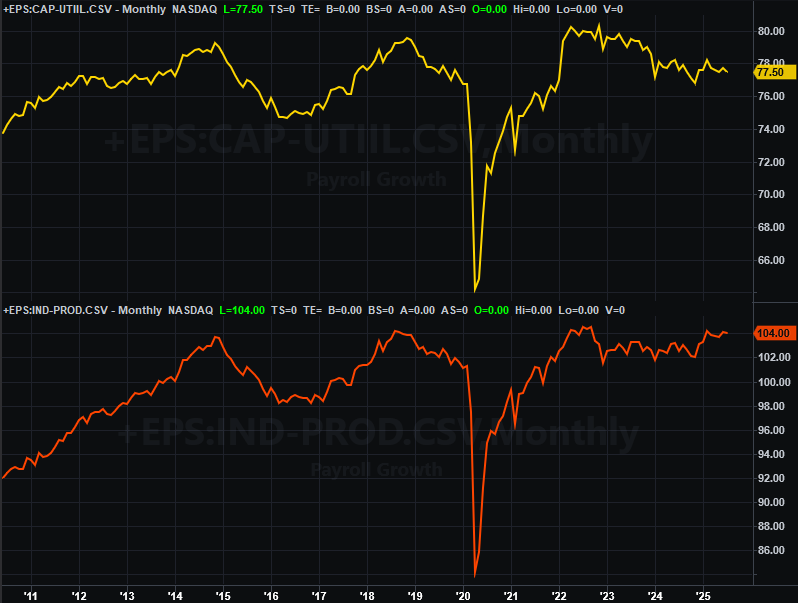
Source: Federal Reserve, TradeStation
This is concerning simply because of all the economic data dropped last week, these two data points are actually the most-closely connected to the economy and the market’s long-term trend. If they’re struggling, it’s only a matter of time before the market takes that lea
Everything else is on the grid.
Economic Data Report Calendar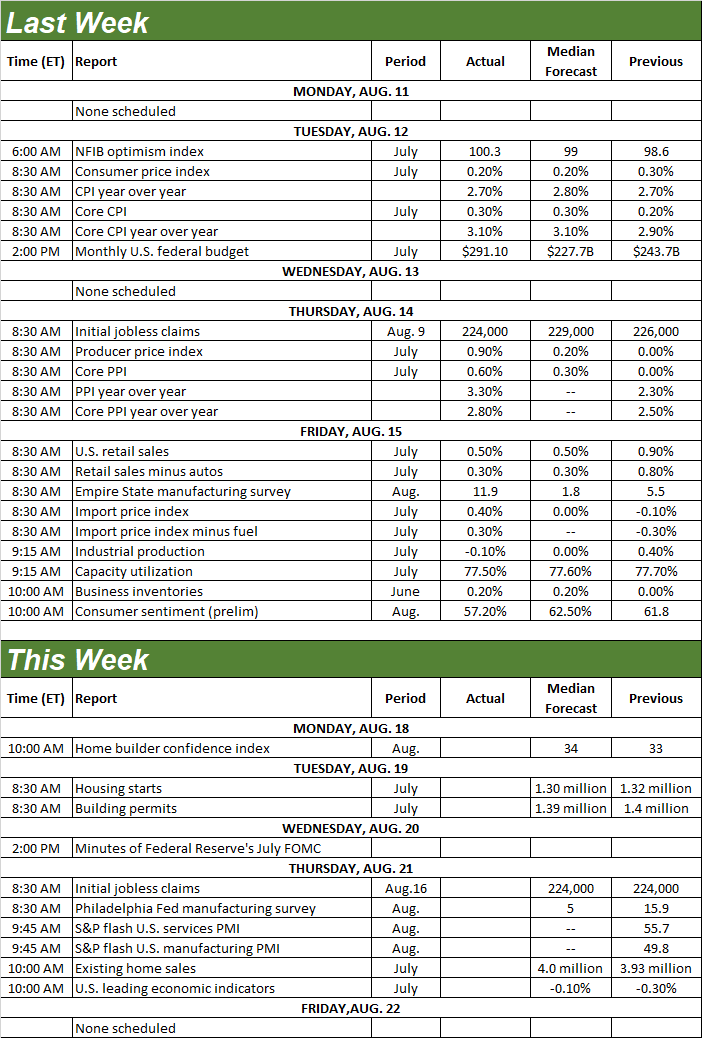
Source: Briefing.com, TradeStation
This week starts a wave of real estate numbers, starting with July’s housing starts and building permits on Tuesday. Economists believe we’ll see slight dips from June’s levels for both, which will (mostly) extend deterioration of both that’s been in place since 2023.
Housing Starts, Building Permits Charts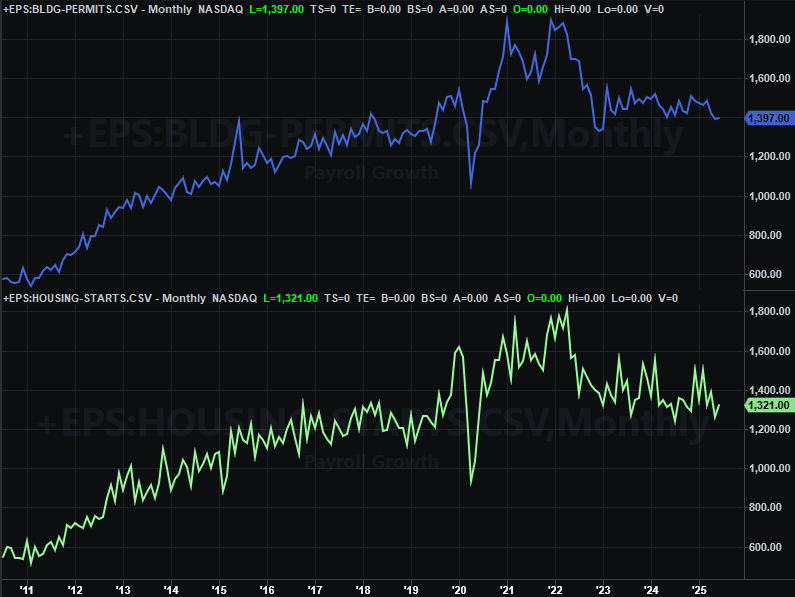
Source: Census Bureau, TradeStation
In this same vein, on Thursday look for last month’s report on sales of existing homes, from the National Association of Realtors. We should see slight improvement here, but certainly not enough to shake the data out of what’s become a rut (largely reflecting sky-high home prices and high interest rates).
Home Sales Charts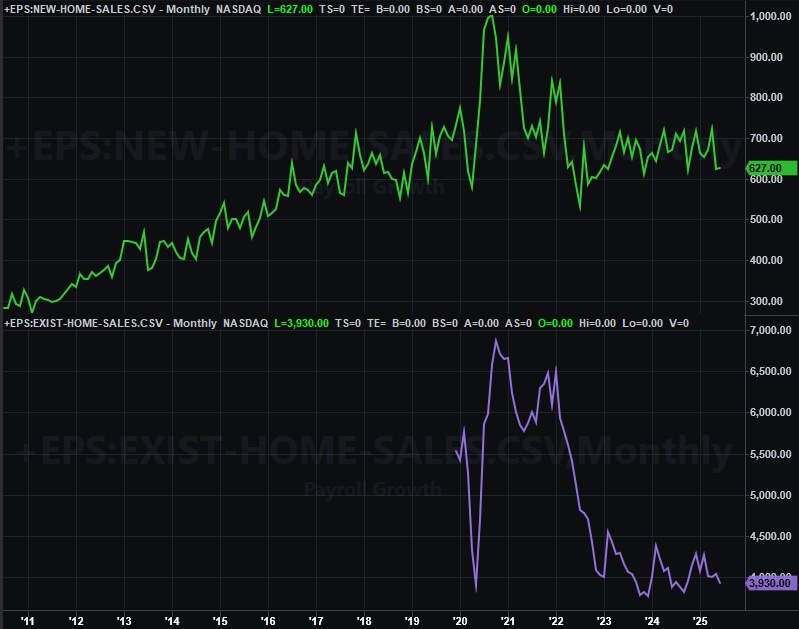
Source: National Assn. of Realtors, Census Bureau, TradeStation
Last month’s new-home sales data will be posted next week. It’s not likely we’ll see any real progress on that front either.
Stock Market Index Analysis
As expected a week ago, the market’s momentum ended up carrying stocks to higher highs. As was also feared a week ago, however, the effort appears to be running out of steam.
The daily chart of the NASDAQ Composite below shows us, after reaching a record high on Wednesday, the index drifted lower the rest of the week to suffer most of that pullback on Friday despite no real reason or prompt. Traders are just increasingly hesitant, as evidenced by the lack of volume we’ve seen for the past couple of weeks now.
NASDAQ Composite Daily Chart, with Volume and VXN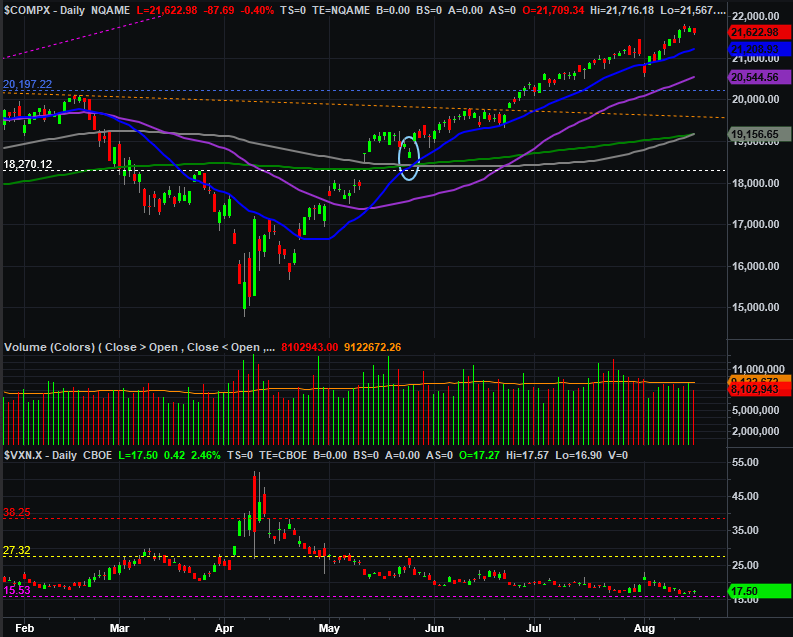
Source: TradeNavigator
Of course, with the VXN being as low as it is, the would-be bulls have good reason to worry this rally effort may be nearly out of gas.
The daily chart of the S&P 500 looks about the same, by the way. It started the week out on a pretty bullish foot, picking up where it left off a week earlier. But, the buyers didn’t want to keep the effort up as the week wore on.
S&P 500 Daily Chart, with Volume and VIX 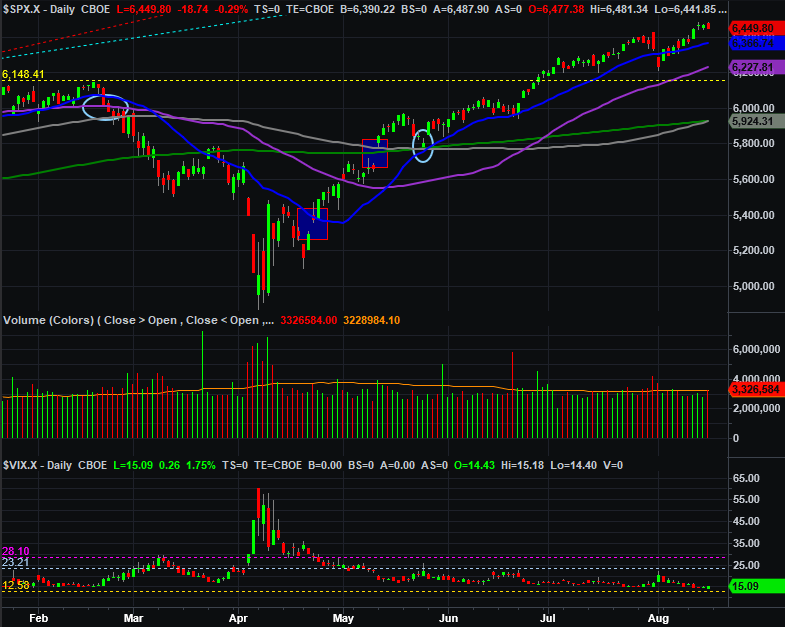
Source: TradeNavigator
Again, notice the VIX is pretty much near an absolute low. That doesn’t mean the market must pull back now. It does, however, make it more difficult to continue rallying.
To fully appreciate what’s happening here, however, you have to zoom out to a weekly chart. Take a look. As the weekly chart of the NASDAQ Composite shows is, the pace of week-to-week gains is slowing down. It’s not easily evident on the MACD lines, but it’s there if you look closely. The only problem? A slowing bull trend still isn’t a bear trend.
NASDAQ Composite Weekly Chart, with MACD and VXN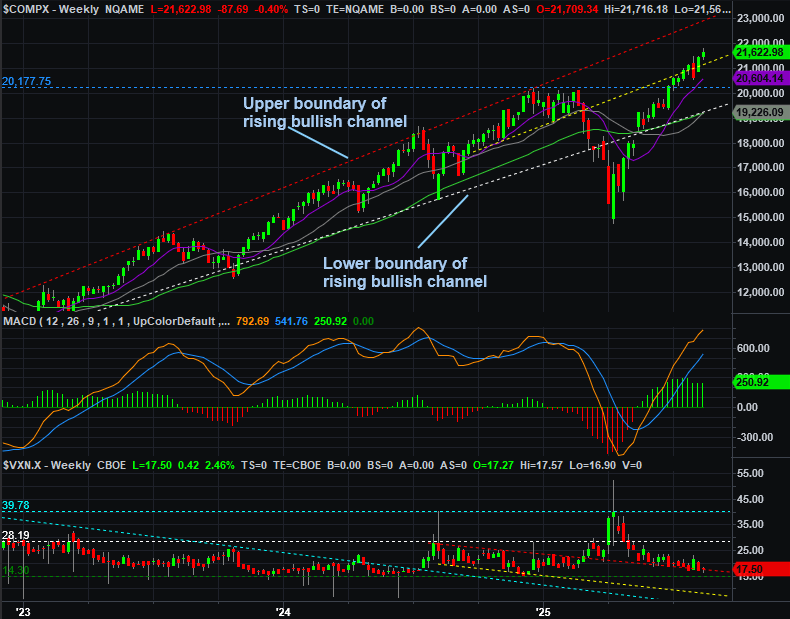
Source: TradeNavigator
The weekly chart of the S&P 500 looks about the same, with one additional detail. That’s the fact that its rally may be slowing down specifically (even of only partially) because it’s now bumping into what was formerly a technical support line (yellow, dashed).
S&P 500 Weekly Chart, with VIX 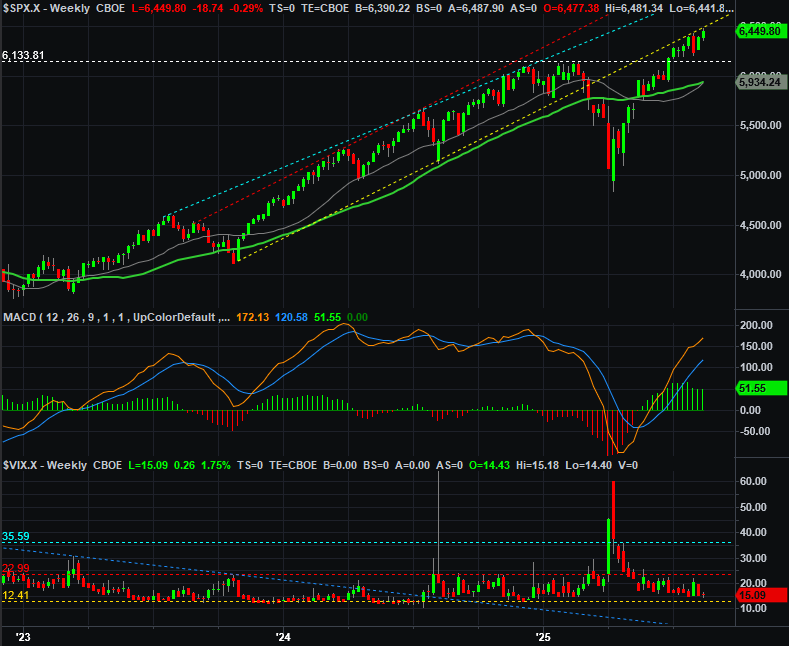
Source: TradeNavigator
Again though, a slower rally is hardly a new pullback.
With all of that being said, it’s worth noting…. While not shown here, the Dow Jones Industrial Average suspiciously only needed to touch record-high territory on Friday to start what ended up being a pretty sizable intraday swing for the worse. Although the Dow is arguably the least-meaningful market barometer, to the extent that a hand-picked basket of blue chip stocks represents the market, this could be a hint that some traders were just waiting to reach a predetermined target before starting to sell. If that’s the case, the other two indexes featured in the charts above may actually be understating their brewing weakness.
The only problem with that bearish prospect is that we don’t yet have any evidence or certainty that it’s going to matter. The trend IS bullish. Even if the indices do pull back a bit from here, there’s still tons of technical support to catch that dip before it gets too bad and breaks the bigger-picture advance (mostly moving average lines).
Here’s some curious food for thought though: We’re now moving toward September, which is reliably one of the worst months of the year. Is it possible the bulls AND the bears are setting up another September swoon? In some ways you almost hope it happens, and that it’s a bad one. A true full correction will not only bleed off all of this overbought pressure, but set up what’s usually the beginning of a year-end rally beginning in mid-October.
But first things first.