BigTrends.com Weekly Market Outlook - October 31, 2016
Stocks tried to get the market back in a bullish groove, staging a pretty solid advance on Monday of last week. It wasn't meant to be though. That rally effort petered out beginning on Tuesday, and then accelerated as the week wore on with the weight of a big Q2 rally still getting in the way. By the time Friday's closing bell rang most of the indices were within easy reach of a major support level. One stumble this week could finally pop this fragile (albeit short-term) bubble.
And if there was ever a week for it to happen, this is the week. There are a handful of major economic announcements and news events in the cards. One of them could dish out a big blow. Of course, we've been in this situation before without the bears getting the job done.
We'll look at the key lines in the sand after running down this week's and last week's key economic numbers.
Economic Data
It was a relatively busy week in terms of economic news, but there's no doubt about the highlight... the grand finale was Friday's GDP growth rate estimate. Though only the first of three estimates, the surprising rate of 2.9% versus estimates of 2.5% growth was a head-turner. That's the highest growth rate seen since the third quarter of 2015 (when GDP grew at 5.0%).
To be fair, unusually high inventory-level growth added 0.6% to the figure. Still, the rate is the rate - inventory buildup is always part of the reading - but even stripping out that part of the growth you're still left with a fairly solid 2.0% expansion.
GDP Growth Chart
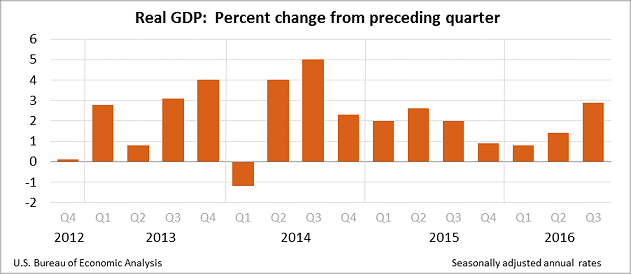
Source: U.S. Bureau of Economic Analysis
That strong reading certainly raises the likelihood of a rate hike before the end of this year.
It was also an important week for consumer sentiment measures, although not necessarily a great one. The Conference Board's consumer confidence score slid from 103.5 in September to 98.6 for this month, while the Michigan Sentiment Index ended October with a final score of 87.2, down from 91.2 in September. While not "trouble" per se yet, we need some help on this front.
Consumer Sentiment Chart
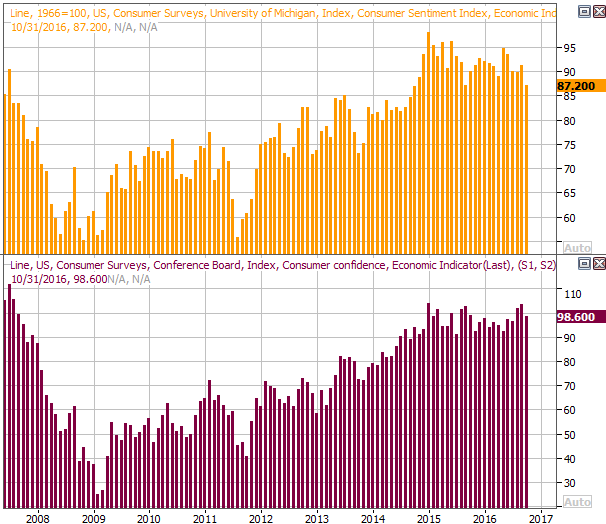
Source: Thomson Reuters
Finally, take a look at the home sale trend with last week's new-home sales data added to the mix. The pace of new home sales grew from 575,000 to 593,000, and that follows a comparable improvement in the pace of existing home sales. Again, a lack of inventory may be holding an already-strong trend back.
New, Existing Homes Sales and Inventory Chart
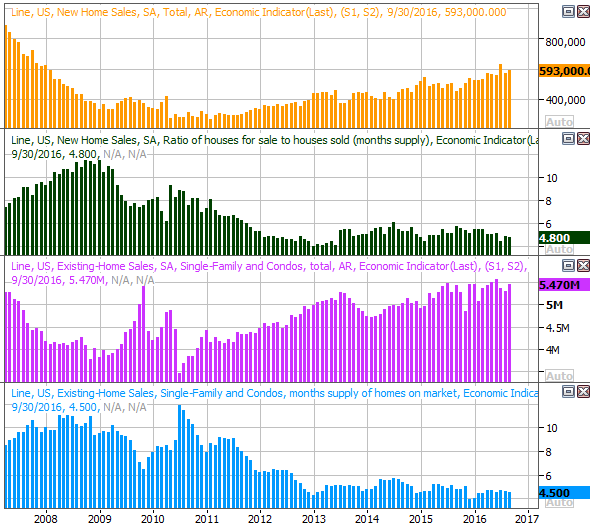
Source: Thomson Reuters
Everything else is on the following grid:
Economic Calendar
Source: Briefing.com
This week is going to be pretty busy, and a couple of the upcoming announcements could be market-moving. The first biggie is Wednesday's interest rate decision, and the other is Friday's employment report for October.
As of the latest look, the market says the odds of an increase in the Fed funds rate this week are only 17%, while the odds of a December rate increase jump to 74%. In light of last week's GDP growth though (in addition to growing dissension among the Fed's voting members), the odds of a November hike could edge higher.
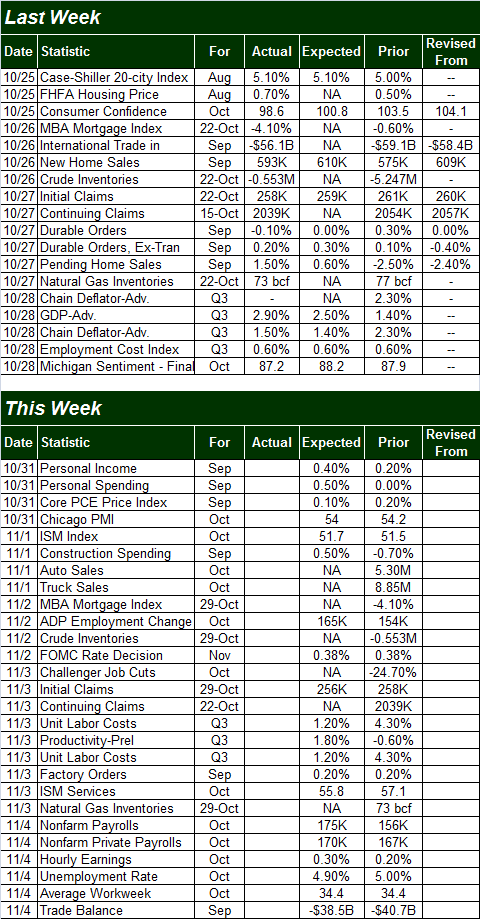
In terms of job growth and unemployment, the pros say the expected payroll growth of 175,000 jobs -- an improvement on September's 156,000 new jobs -- should be enough to push the unemployment rate down from 5.0% to 4.9%. While the current levels on both numbers are healthy, a closer look at the trend through September's numbers shows something of a slowdown for both measures. A "beat" would be very reassuring, although that would also accelerate any rate-hike plans.
Payroll Growth and Unemployment Rate Chart
Source: Thomson Reuters
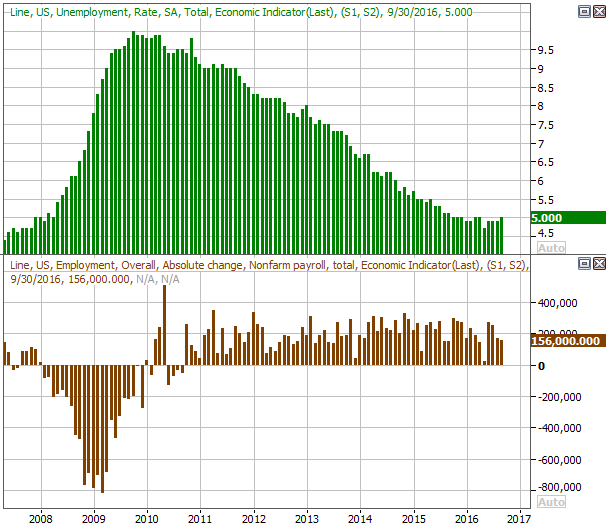
Although not quite as potentially explosive, we'll hear about October's auto sales on Tuesday. After a period of tapering off during the first half of the year, things perked up a bit in September. No forecasts exist, but the numbers are apt to be very good for auto stocks, or very bad, depending on where they fall relative to the prior month's pace.
Auto Sales Chart
Source: Thomson Reuters
Stock Market Index Analysis
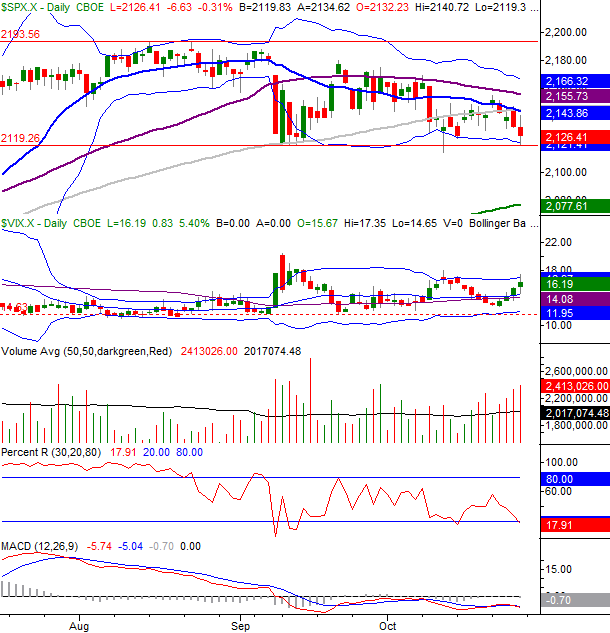
The bulls are still fighting, but they're losing the battle. The S&P 500 (SPX) (SPY) fell 0.7% last week, logging the sixth loss in the past eleven weeks, and the third loss in the past four weeks. It's not yet past the tipping point, but it's close, and pointed in that direction.
Take a look at the daily chart of the S&P 500 -- it's pretty clear to see. The index is knocking on the door of support at 2120 for the third time since early September, where the lower Bollinger band also lies. This time is different in a couple of key ways though. This time, the Percent R line is below the 20 threshold, and the 20-day moving average line is below the 100-day moving average lines. These last two clues may well serve as the clincher for the downtrend that's been brewing up since August.
S&P 500 & VIX Daily Chart
Chart created with TradeStation
There's actually a third bearish clue here, though it's more subjective than objective - selling volume is above average, and rising. A quick look at the volume bars on the chart above makes that pretty clear. The sellers are starting to come out of the woodwork.
The daily chart of the NASDAQ Composite (COMP) doesn't look too different. That is, we're starting to see a significant amount of selling volume, and the index is on the verge of making its first lower low (under 5170) in weeks. The MACD lines have also crossed below zero, and refreshed their bearishness with a new bearish divergence earlier in the week.
NASDAQ Composite & VXN Daily Chart
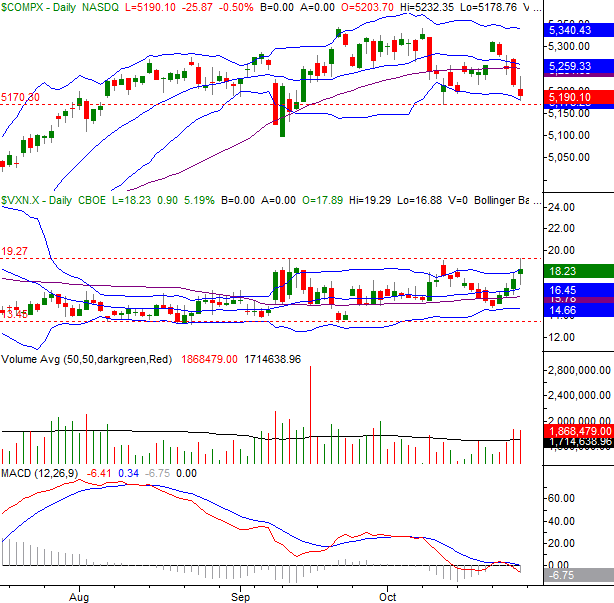
Chart created with TradeStation
It doesn't tell us anything new, but zooming out to a weekly chart of the NASDAQ does offer us some better perspective on how and why this weakness is taking shape. The rally since early July has been quite strong, and now the weight of that gain is bearing down.
NASDAQ Composite & VXN Weekly Chart
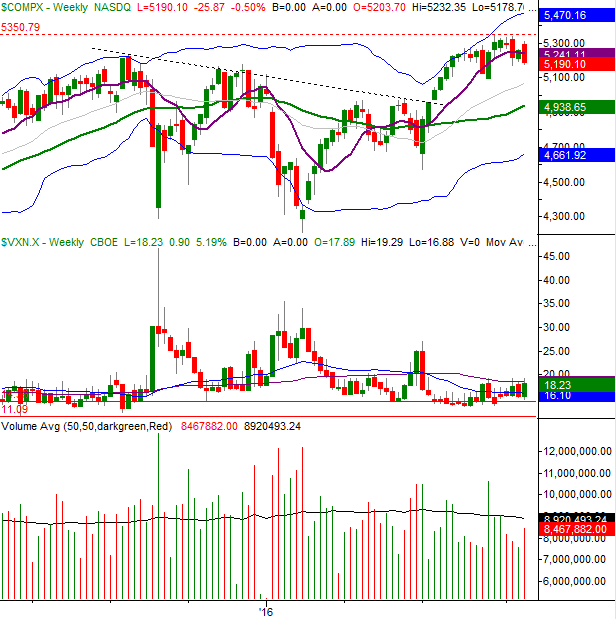
Chart created with TradeStation
It's also in this timeframe we can see that while the Nasdaq Volatility Index (VXN) is broadly trending higher, it's nowhere near an absolute peak that would normally suggest a major bottom had been made. The VXN would need to spike to something above 25 to suggest a fear-based low had been logged.
Until the S&P 500 breaks below 2120 though, and until the NASDAQ falls under 5170, there is no actual downtrend to tap into yet. The BigTrends TrendScore ended the week at 46.0. That's down from the midpoint of 50, towards bearishness. It's not actually bearish yet though. It would need to move below 40 to flip to a bearish condition. If that's in the cards, it will be underscored by lower lows from the key indices.
The bulls are backpedaling, but the bears haven't quite yet struck a decisive blow.
Trade Well,
Price Headley
BigTrends.com
1-800-244-8736