Wall Street's 'fear index' drops to levels not seen since before stocks fell in to correction
- The VIX is on track for its fifth straight weekly decline -
By Ryan Vlastelica, MarketWatch
There is a lot of uncertainty in the U.S. stock market right now, but not nearly as much fear as there used to be.
Based on one popular metric for volatility in the equity market, investor anxieties seem to have dropped precipitously of late, helped by a continuing recovery in stock prices.
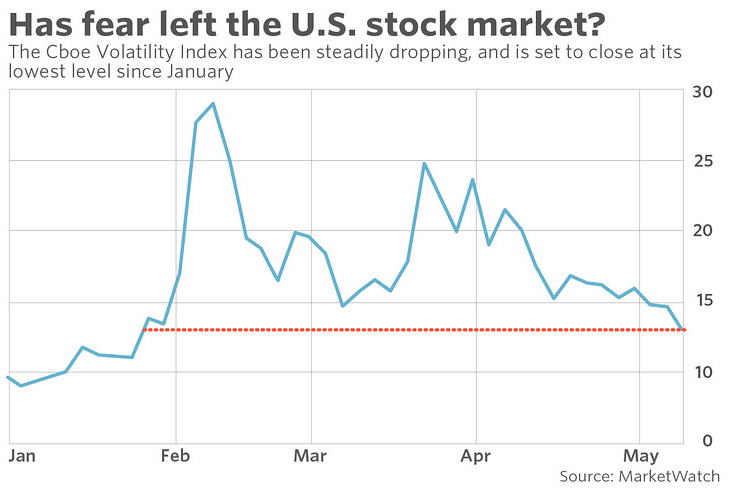
The Cboe Volatility Index dropped 0.5%, or 0.05 point, to 13.19 on Friday. It was on track for its seventh straight daily decline, its longest such streak in a year, as well as its lowest close since Jan. 26. The VIX has completely erased the massive spike it saw in early February, when concerns over inflation saw Wall Street's so-called "fear index" more than double in a single session amid a stock selloff that sparked a correction for major indexes.
Historically, the VIX's average value is between 19 and 20, meaning that the current level is extremely low by historical standards. This hasn't been unusual of late, as 2017 was one of the least volatile years in history, but it does represent a marked change from earlier this year, which has seen big swings in both directions on a near-daily basis. The VIX, following those moves, saw massive swings of its own.
On Wednesday, the VIX closed below its 200-day moving average for the first time since Jan. 12. Dropping below this closely watched technical indicator is often taken as a sign that more losses may still be in store. In this case, that would be a bullish signal for equity investors, as the VIX, which reflects S&P 500 option bets to calculate expectations for volatility over the coming 30 days, tends to decline as stocks rise. It is down more than 55% over the past three months.
Thus far this week, the VIX has shed 10.7%, putting it on track for its fifth straight weekly drop, its longest such stretch since August 2016. The index, however, is still up about 19% so year to date
The Dow Jones Industrial Average is up 2.3% thus far this week, while the S&P 500 is up 2.4% and the Nasdaq Composite Index is on track for a weekly advance of 2.7%.
Despite the recent gains in stocks, both the Dow and the S&P have been mired in correction territory since February, their longest such stretch since the financial crisis. While the issues that initially pushed stocks lower-concerns over inflation and trade-policy uncertainty-have eased or moved to the background, major indexes have remained stubbornly stuck in a tight trading range. Both the Dow and the S&P are more than 5% below record levels.
From MarketWatch