Using Fibonacci To Find Key Long-Term Levels
Placing Fibonacci Grids Is Key To Your Trading Strategy
by Alan Farley
The Fibonacci grid found in popular charting programs lets traders uncover hidden support and resistance created by the Golden Ratio, but most fail to tap its enormous potential because they don't know how to stretch the grid, often picking the wrong prices. Even worse, they fail to add long- term grids that are often needed for an in-depth harmonic analysis. Let's correct these technical errors with a quick primer on the most effective ways to construct perfectly placed grids.
The Fibonacci grid supports all sorts of profitable trading strategies, but incorrect placement undermines prediction and confidence, generating misguided entries and exits. Traders get frustrated when this happens, often abandoning the tool in favor of more familiar analysis tools. But persistence pays off because the arcane mathematics outlined by Leonardo de Pisa, aka Fibonacci, in the 13th century give birth to trading edges that last a lifetime.
The grid supports both retracement and extension analysis. A retracement happens when price turns and tests the last trend, higher or lower. An extension occurs when price clears the grid and pushes into a new high or low. Traders learning to use the grid effectively should stick to retracement analysis because moving averages, round numbers and gaps will intersect with key levels, assisting price prediction.
Zoom Out, Zoom In
Start grid placement by zooming out to the weekly pattern and finding the longest continuous uptrend or downtrend. Place a Fibonacci grid from low-to-high in an uptrend and high-to-low in a downtrend. The grid should be set up to display the .382, .50 .618 and .786 retracement levels. View the first three ratios as compression zones, where price can bounce around like a pinball and the .786 as a line-in-the-sand for the trend, with violations then yielding 100% retracements that signal trend changes and trading ranges.
Now move to shorter-term trends, adding new grids for those time frames. Once completed, your chart will show a series of grids, with lines that are tightly aligned or not aligned at all. Tight alignment identifies harmonic support and resistance levels that can end corrections and signal new trend advances, higher or lower, especially when supported by moving averages, trendlines and gaps. Loose alignment points to disorganization, with conflicting forces generating whipsaws that lower predictive power and profit potentiall.
Targeted Grid Analysis
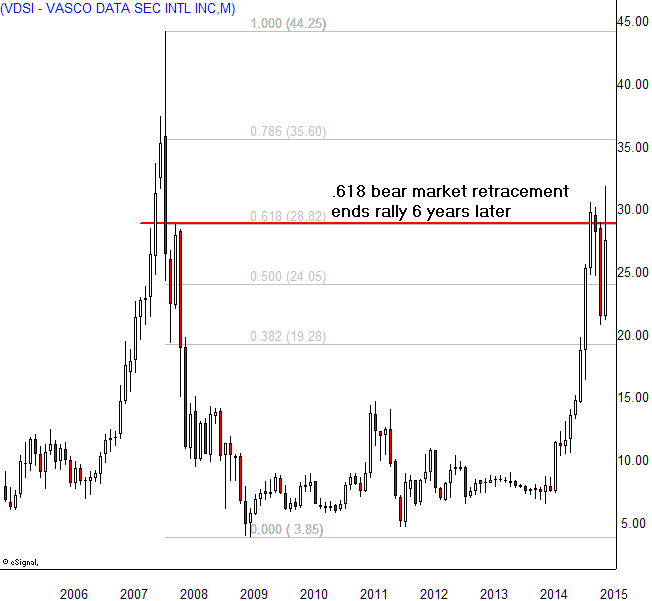
Gain experience with multiple grid placement and then cut your workload by ignoring harmonics that come won't into play during the position's life cycle. For example, it makes no sense for a day trader to spend time looking at weekly levels that have no bearing on intraday exposure. But common sense also dictates that trades lasting for weeks may reach deep harmonic levels going back five or six years. A narrow focus on key harmonics isn't hard to learn, often requiring a quick glance at long term trends to confirm they won't interact with expected price action.
Next, apply a small dose of formfitting to align your grid more closely to charting landscape features, like gaps and intermediate highs and lows. Move the start or end point to the next most obvious high or low to see if it fits better with historic price action. This often means choosing the higher low of double bottom or lower high of a double top. Just be careful because formfitting can elicit false signals unless used sparingly.
A Real World Application
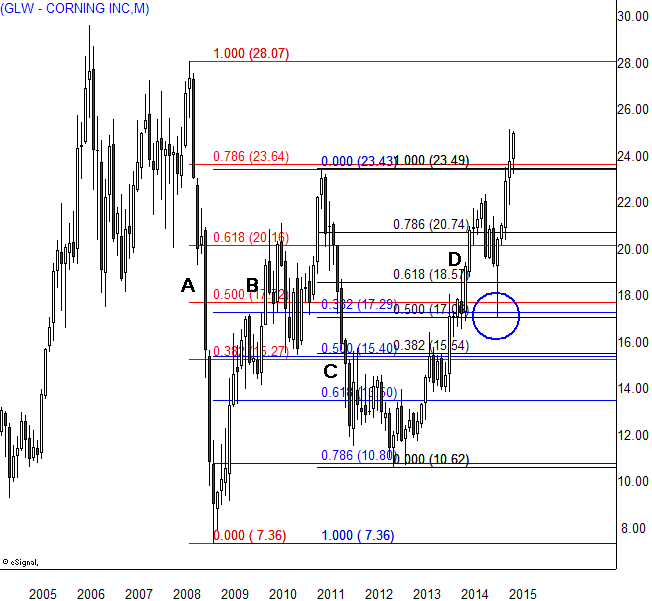
Corning (GLW) grinds through 4 major trends in 7 years. The 2008 crash (A) gave way to a 2-year bounce (B) that yielded multi-month reversals at the .386, .618 and .786 retracements. The downtrend into 2012 (C) adds a third trend, finding support at the.786 retracement of the bounce and yielding a new uptrend into 2015 (D). We can't place a grid over that price swing yet because it doesn't show an obvious end point but we can estimate it will reach the 2008 high because it's cleared all harmonic resistance levels.
The three grids align tightly in clusters near 15.50, 17.50 and 20.50, identifying hidden harmonic support and resistance levels. These come into play many times, triggering narrow range action that lasts for months, before giving way to the next cluster. The 2014 pullback (blue circle) highlights the profit potential of these magic numbers, with price dropping like a rock into the 17.50 cluster and then rocketing to a 6-year high.
The Bottom Line
Build your Fibonacci skills by finding the longest term price swing on your chart of interest and placing a grid over the trend. Repeat at shorter intervals, looking for tightly aligned clusters that reveal profitable entry and exit levels.
Courtesy of Investopedia