US Indexes Reaches Fibonacci Target Zone – Where to Next?

Near December 21, 2018, our research team began a series of posts indicating the US Major Indexes should be set up for the “Ultimate Bottom” low that we suggested would take place after the US Elections (November 2018) and which would launch an upside price rally. Today, we are writing to announce that the first leg of this upside move appears to be nearly completed.
It is critical to mention here that as of only a day go the short-term market trend from a technical standpoint has turned up. So, getting long before this point would be trying to catch a bottom which is tough and risky to do. The good news is that we are expecting a second leg higher after we get some rotation to the downside.
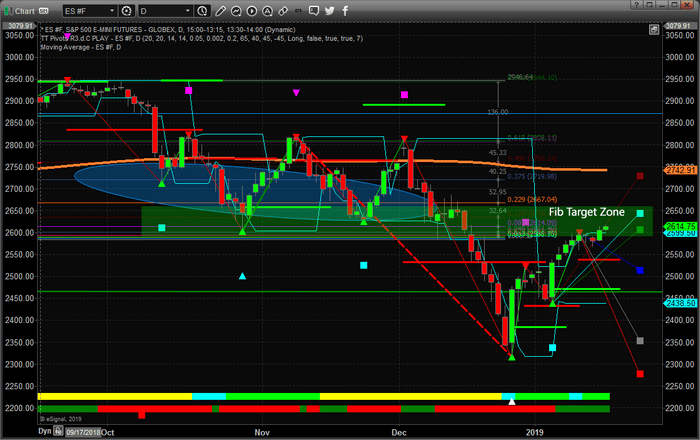
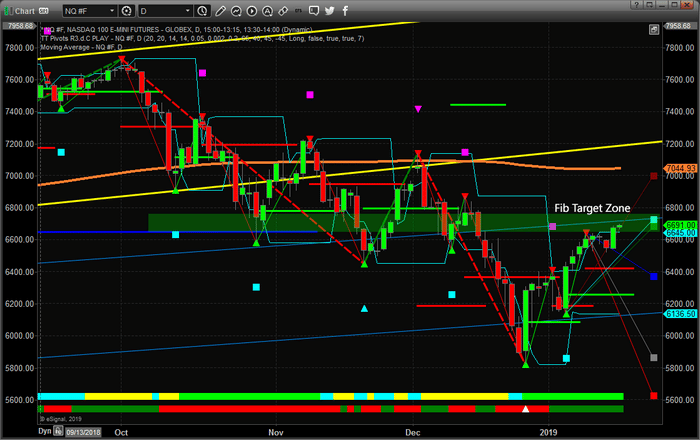
Using our Adaptive Fibonacci Price Modeling system, we can see that the current prices of the ES and NQ are very near to the immediate Fibonacci Price Target Zone. You will see from the following charts that both the ES and NQ are already within this zone and/or very near to what we believe will be immediate resistance. This means we should expect a bit of price rotation near these levels before another upside leg takes place driving prices higher.
This first Daily ES chart shows the Fibonacci Target Zone clearly in Green. You can see how price has rallied up to near this level and may even rally a bit further before rotating downward a bit. Remember, price rotation in a trend is very healthy for normal markets. When price moves extensively in one direction or another is somewhat unhealthy and dangerous. When price moves up or down in rotating waves or price cycles, this is a very healthy means for the price to establish support/resistance and to wash out groups of traders that may be biased in the markets.
This Daily NQ chart shows a very similar, although more narrow, Fibonacci Target Zone. The result is virtually the same as the ES chart. Price should attempt to establish some resistance within this zone and the potential for a downside price rotation increases near this level. We are expecting a downward price move, possibly toward the BLUE Fibonacci downside target square level, before the price rally resumes to drive prices above recent highs and into the next leg higher.
If you have followed our analysis, on September 17, 2018, we predicted 4~5 months into the future what would likely happen. Our call for an “Ultimate Low” price reversal after the Nov 2018 elections appears to be setting up perfectly. Although we did not predict this extreme low price level in that research post, the overall expectations we had in September were nearly perfect.
If the remainder of our analysis continues to play out as accurately, we should be setting up for a very big move to the upside over the next couple of months. It will likely be paired with decent earnings data from the US, moderately strong economic data and the resulting economic improvements of a China Trade Deal and the resolution to the US Government Shutdown. The issues in Europe are set to reach a peak somewhere near March or April 2018. We expect the US markets to be trading several percents higher by that time.
Pay attention to these markets moves. 2019 is poised to be a very exciting and profitable year for skilled traders and wise investors. Visit www.TheTechnicalTraders.com to get our daily and weekly analysis forecast complete with long term investing swing trading, and index day trade signals.
53 years experience in researching and trading makes analyzing the complex and ever-changing financial markets a natural process. We have a simple and highly effective way to provide our customers with the most convenient, accurate, and timely market forecasts available today. Our index, stock and ETF trading alerts are readily available through our exclusive membership service via email and SMS text. Our newsletter, Technical Trading Mastery book, and 3 Hour Trading Video Course are designed for both traders and investors. Also, some of our strategies have been fully automated for the ultimate trading experience.
Chris Vermeulen