This Marketwide Weakness Isn't Really About Politics
The knee-jerk explanation for Thursday's weakness is more political volatility; Trump attorney John Dowd is stepping down, alluding to continued turmoil in the White House. Investors are also still digesting Wednesday's expected rate hike, parsing the new language with new chairperson's Jerome Powell's first such decision. Inflation may be a little less tamed than had been figured.
And to tell the truth, those things are legitimate causes for concern. A closer look at some usually-ignored data, however, suggests there's more going on in investors' minds than just some uncomfortable headlines though. And, it's been going on for a little longer than just the past couple of days.
That's a bigger-picture concern for the overall market.
We've talked about this before but it bears repeating now... you can tell a lot about how traders feels from seeing which stocks they're buying, and which stocks they're not buying. If they're buying into defensive areas and shunning riskier growth stocks, they're tending to doubts that may well lead to a self-fulfilling prophecy.
Great, but how does one do that sort of analysis effectively? Fortunately we have a simple chart that helps us do this.
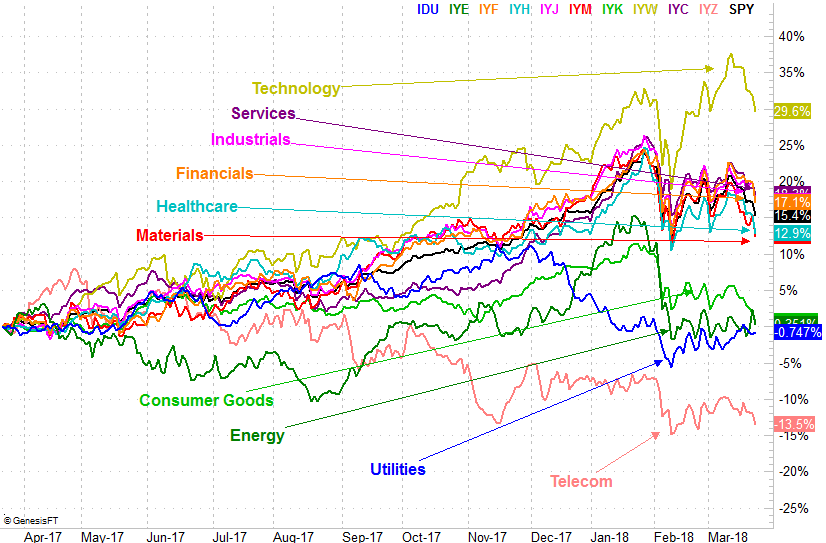
The graphic below is one regular BigTrends readers have seen before, comparing the percent returns of all the major market sectors over the course of the past twelve months. A close inspection reveals that all major areas have lost ground over the course of the past week, save one... utilities. It's up for the timeframe in question, reversing weakness it solely experienced in December and January of last year when investors were more than happy to scratch their "risk on" itch.
In short, it's a curious flight to safety.
Some might argue that the sudden rise in the value of utility stocks has more to do with changes in the interest rate environment. Namely, in that utility stocks are almost bonds in that they're best known for steady dividend payments (like a bond coupon) rather than growth, falling interest rates have translated into rising utility stock prices.
There may well be some element of that in the rally here too. The argument doesn't hold a lot of water though. While yields began to fall a little in late February, utility stocks rose by far more than one would have expected. And, yields have been rising (bond prices have been falling) since mid-March - until today -- but utility stock values have been rising anyway. Rates fell pretty significantly on Thursday, but utilities were only up a hair. If they were trading in tandem, the utility sector would have been up a lot more.
In other words, this appears to be more about defensive posturing into the market's safe havens and less about finding a strategy to play changes in yields.
And for the record, yes, the market as a whole - the other nine sectors - pushed the indices to the brink. But no farther.
Take a look at the daily chart of the S&P 500 below. The index broke under its 100-day moving average line (gray), but found support at the lower 20-day Bollinger band. Notice the VIX also put pressure on its upper Bollinger band, but was unable to push through it.
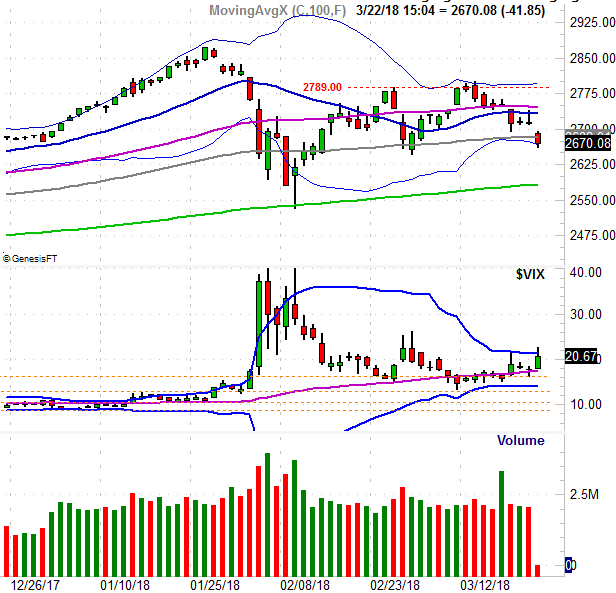
This is as it should be. Bollinger bands point out how far is "too far" for stocks and indices in a certain timeframe, and in both cases the index went about as far as they could travel... for now. The bears could easily take another swipe though, and succeed at breaking through the wall with the next effort. The outlier strength in utilities says they've already planned on it happening.
No, none of it is set in stone. Anything can and likely will happen. It would be naive to ignore the clues though... particularly the meaningful hints nobody else is looking at.
One more good day for utility stocks at the expense of everything else coupled with the S&P 500's tumble below the lower Bollinger band, and you've got good reason to be afraid. After that, all eyes would turn their focus to the 200-day moving average line (green). It was a clear support and reversal level in early February, but we may not be so lucky with the second test.