This 501-day trading streak for the Dow just came to a screeching halt
- The Dow's run above 200-day moving average is the third lengthiest, according to Bespoke -
An uncanny streak for the Dow Jones Industrial Average, which had underlined its bullish momentum, ended on Monday, signaling that a bearish turn may be at hand.
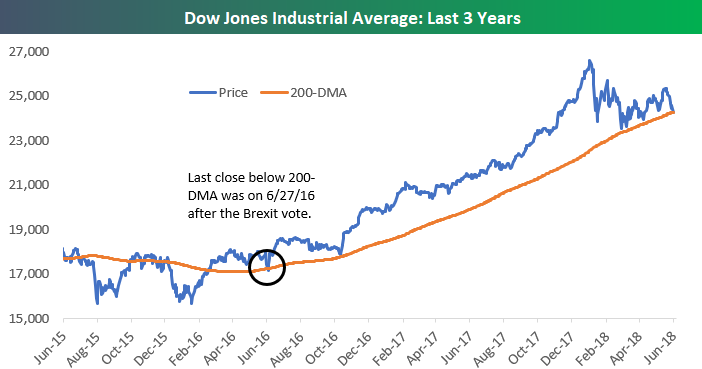
The Dow closed sharply lower, falling around 328 points, or 1.3%, to 24,252.80, below its 200-day moving average, which stood at 24,280.02. That represents the first close below the average since the summer of 2016, when the U.K. vote to exit from the European Union sent shivers through global markets.
According to Bespoke Investment Group, "the Dow hasn't closed below its 200-day moving average for 501 consecutive trading days going back almost two years exactly to June 27, 2016 (when the market reacted negatively to the UK Brexit vote)."
Source: Bespoke
Technical traders use moving averages to help gauge an asset's long-term and short-term momentum. Equity investors have been spooked by the prospect of a full-blown trade war between the U.S. and China.
The streak of 501 consecutive trading days above the 200-day moving average is the Dow's third longest since 1952, when the New York Stock Exchange began its current five-day-a-week trading schedule, the Bespoke researchers said.
The only longer stretches were a 652-day run that ended in May 1956 and a 715-day stretch that ended in October 1987, they said (see graphic below):
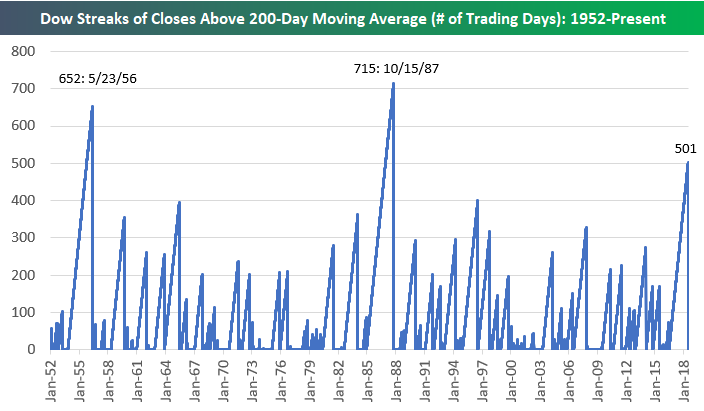
Source: Bespoke
Other key U.S. equity gauges also closed sharply lower, with the S&P 500 index, off 1.4% at 2,717 and the Nasdaq Composite Index, off 2.1% at 7,532.
From MarketWatch