The stock-market correction may be only half over, if history is any guide
- The average S&P 500 correction lasts 51 trading days; it's been 25 -
By Ryan Vlastelica, MarketWatch
The S&P 500 is off its 2018 low, but it has yet to return to the record territory it explored through much of January. And if history is any indication, investors might have several more weeks to wait.
According to the WSJ Market Data Group, the S&P 500 has been in correction territory-defined as a 10% drop from a peak, in this case a record high hit on Jan. 26-for 25 trading days, including Thursday's session. This puts it roughly halfway through the duration of such drawdowns.
While a full recovery would mean hitting new highs, the S&P would exit the correction if it rises to roughly 2,840, or a 10% gain from its February closing low.
Going back to the inception of the index, the average correction lasts 51 trading sessions, according to the data, although more recent ones have proved to be more short lived. The last five corrections have only lasted an average of 37 trading days, while going back to 1980, the average length has been 44 sessions. (Since 1950, the average lasted for 61 trading days.) The data doesn't include corrections that expand into a bear market, or a 20% drop from a peak.
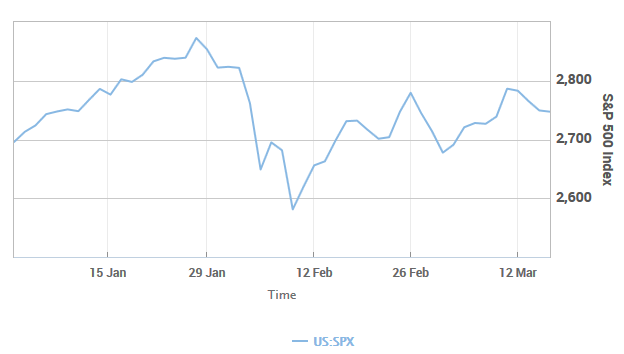
Going from peak to trough, the S&P fell 10.2% in its most recent pullback, going from the closing high to the closing low (on an intraday basis, it fell 11.8%). It is currently trading around 2,750, up 6.7% from the closing low (8.7% from the intraday low), but still 4.2% below its high.
The performance puts it in the middle of the pack among the major indexes. The Dow Jones Industrial Average is down 6.2% from its own record, while the Nasdaq Composite Index-which, unlike the Dow and the S&P, didn't fall into correction territory in its recent decline-has hit records in this past week. It is currently 1.8% below its most recent all-time high.
The Nasdaq has recently been supported by gains in large-capitalization technology and internet stocks. As was noted by Lindsey Bell, an investment strategist at CFRA, "After the market and technology bottomed in correction territory on February 8th, tech quickly returned to its January 26th peak, in a matter of only 11 days. It remains the only sector that has regained and surpassed the recent peak."
While investors may be eager for another record, most are likely more concerned with whether the recent low represented the bottom of the current pullback. According to Bespoke Investment Group, which analyzed the 95 corrections the S&P has seen since 1928, the median decline for an S&P decline is 16.4%.
There is some good news for those who want to play the odds. Since World War II, according to data from Goldman Sachs, there have been 36 S&P 500 corrections. Of those, 24 didn't presage the start of a recession. Furthermore, of the 24 corrections that didn't coincide with a recession, 20 of them didn't lead to a bear market. In the corrections that didn't turn into bear markets, the median decline for the benchmark U.S. index was a drop of 13%.
Investors have recently been caught in a tug of war, with indexes mostly range bound as market bulls and bears debate what the next move will be. Bulls have been pointing to improved corporate earnings, the recently passed tax-reform bill, and strong economic data as reasons to think the uptrend hasn't yet played out. Bears have been fretting about valuations, the prospect of inflation returning to markets-which could lead to the Federal Reserve aggressively raising interest rates-and the impact of tariffs and other policies that point to a more protectionist stance with respect to trade.
Morgan Stanley, in a Monday note to clients, speculated that the high hit in January and the low reached in February "about established the high and low end of valuations for U.S. equity markets" for the rest of the year.
"We believe it will prove difficult for the S&P 500 to trade outside of the 16-18x forward 12 month [price-to-earnings] range for the remainder of 2018," wrote Michael Wilson, the investment bank's chief U.S. equity strategist.
From MarketWatch