Ouch. That wasn't fun. On the other hand, it happens. In fact, there are some compelling upsides - bullish aspects - to Thursday's near-6% stumble for the S&P 500. Yes, the sheer depth of the selloff sets the stage for a bounce. That's no guarantee though, and even if it were, it wouldn't necessarily have to take shape right away. The market could still lose ground before gaining some back.
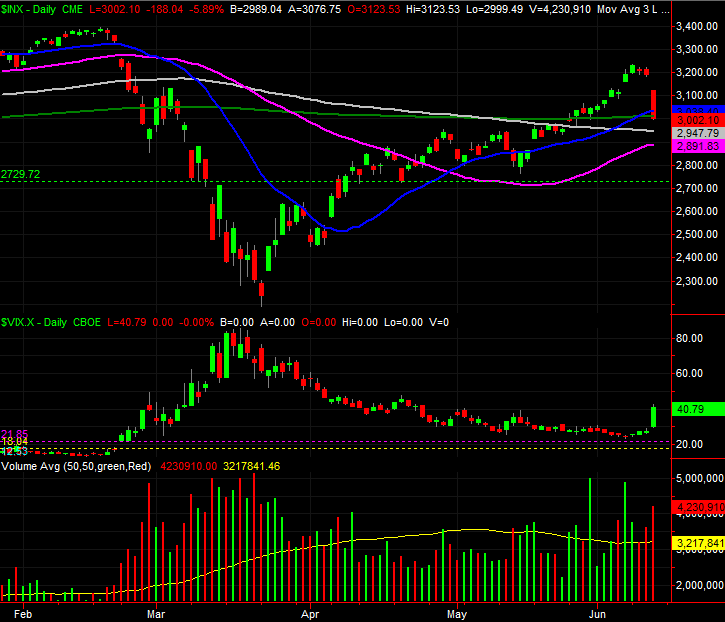
But, first things first. Let's just explore what happened. Take a look at the daily chart of the S&P 500 itself. Nasty stuff. The S&P 500 suffered one of its worst daily selloffs since March, when traders were first digesting the fallout from the coronavirus outbreak. Things started bad, and quickly turned worse. After leaving behind a bearish gap at the open, the index continued to slide until it closed below its 20-day moving average line (blue) and just below its 200-day moving average line (green). Ideally, we would have liked to have seen a little more support from either or both of those lines... even if just temporarily. They didn't even try.
That's not the end of the world. The 100-day (gray) and the 50-day (purple) moving average lines are still below where the S&P 500 ended the session, and it may take some more time for the other two moving average lines to figure out how to come back into play. In fact, the entire zone between 2891 and 3038 is support. We have to give the index some wiggle room all along that range.
The daily chart above doesn't suggest there was a massive amount of volume behind the move... more than average, but not a ton. Don't be deceived. There was a lot of bearish volume, and very little bullish volume. The graphic below explains. The day's bullish volume for the NYSE (UVOL) fell to its lowest level in weeks, while the total bearish volume (DVOL) hit levels not seen since March's rout. [Advancers (ADV) and decliners (DECL) were similar disparate, but more on that in a moment.]

It seems problematic on the surface, and there's certainly a reason to be concerned. But, it's not a reason to count on the worst-case scenario panning out here.
It's a rarely-discussed too because it's a bit too esoteric and philosophically challenging for most traders to tackle. We're going to though, just because it's worth the time or effort. What's that? The Arms Index, or TRIN.
The Arms Index is a tool devised by a trader named Richard Arms, though it's also sometimes referred to as the Trading Index, or TRIN for short. In simplest terms, the Arms Index is a comparison of an exchange's (or market's) bullish and bearish volume and that exchange's (or market's) advancers and decliners. It's a ratio of two other ratios, intended to look for balance or imbalance between that volume and advancers/decliners. A little imbalance is normal, but a lot of imbalance often sets the stage for a sweeping reversal to unwind that tension.
The image below compares the S&P 500 to the Arms Index - or TRIN - for the NYSE's stocks. The daily TRIN data is too erratic to analyze; those are the white dots on the lower portion of the chart. But, a moving average of those daily readings points to periods where the Arms Index ratio ventures "too far away" from its baseline norm of 1.0. Too low, towards 0.9, and stocks are overbought and ripe for a pullback. Too high, near 1.2, and the market is oversold and ripe for a bounce. Those instances and their corresponding are all marked with red arrows. The Arms Index's current reading isn't too high yet, but it's close... the rally since the middle of last month was never quite as firm as it may have seemed on the surface. That's good though. It means we're actually closer to a bottom than a top even though it seems as if we shouldn't be.

Be forewarned... the Arms Index isn't a laser-precise tool in terms of timing market turns. It may not be on-target at all. But, it's always wise to explore all the possibilities, and explore the ones that are giving you a hint that's not being dropped anywhere else.