The Charts of Canopy Growth Are Missing Signs of Accumulation for Now
For his first "Executive Decision" segment of Mad Money Monday night, Jim Cramer sat down with Mark Zekulin, the outgoing CEO of Canopy Growth Corp. (CGC) , a stock that has returned to the levels where Constellation Brands (STZ) took a stake in the company 13 months ago.
Zekulin said that Canopy is not just about their past, present or future CEO, it's about their 4,000 employees across five continents, and about their infrastructure and intellectual property, and their culture of delivering excellence.
When asked about the recent vaping-related illnesses and deaths in the U.S., Zekulin said there are still a lot of things we don't know about the mystery illness surrounding vaping. But he noted that the types of processes and controls that bigger companies like Canopy can provide help to ensure quality and accurate dosing for all cannabis products.
One of those cannabis products Zekulin was most excited about was beverages. He said Canopy is the perfect company for getting the dosage, form factor and branding right when it comes to beverages, and they also have the ability to make those beverages taste great thanks to their partnership with Constellation Brands.
Let's skip the drinks and go straight to the charts and indicators.
In this daily bar chart of CGC, below, we can see a downtrend from late April/early May. CGC is below the declining 50-day moving average line and the falling 200-day moving average line.
In July we can see that the 50-day line falls below the 200-day line for what is commonly called a dead or death cross or sell signal.
The On-Balance-Volume (OBV) line has been weakening since early May and tells us that sellers of CGC have been more aggressive. The Moving Average Convergence Divergence (MACD) oscillator moved below the zero line in May and is turning lower again this month.
In this weekly bar chart of CGC, below, we can see a 10-fold rally from 2017 to 2018 and now the price action above $25 looks like a large top formation. Prices are below the declining 40-week moving average line and the chart support around $25 is being tested.
The OBV line is bearish and close to breaking below the 2018 low. The MACD oscillator is well below the zero line in sell territory but we might have a cover shorts signal in the weeks ahead as the two moving averages of this indicator are narrowing.
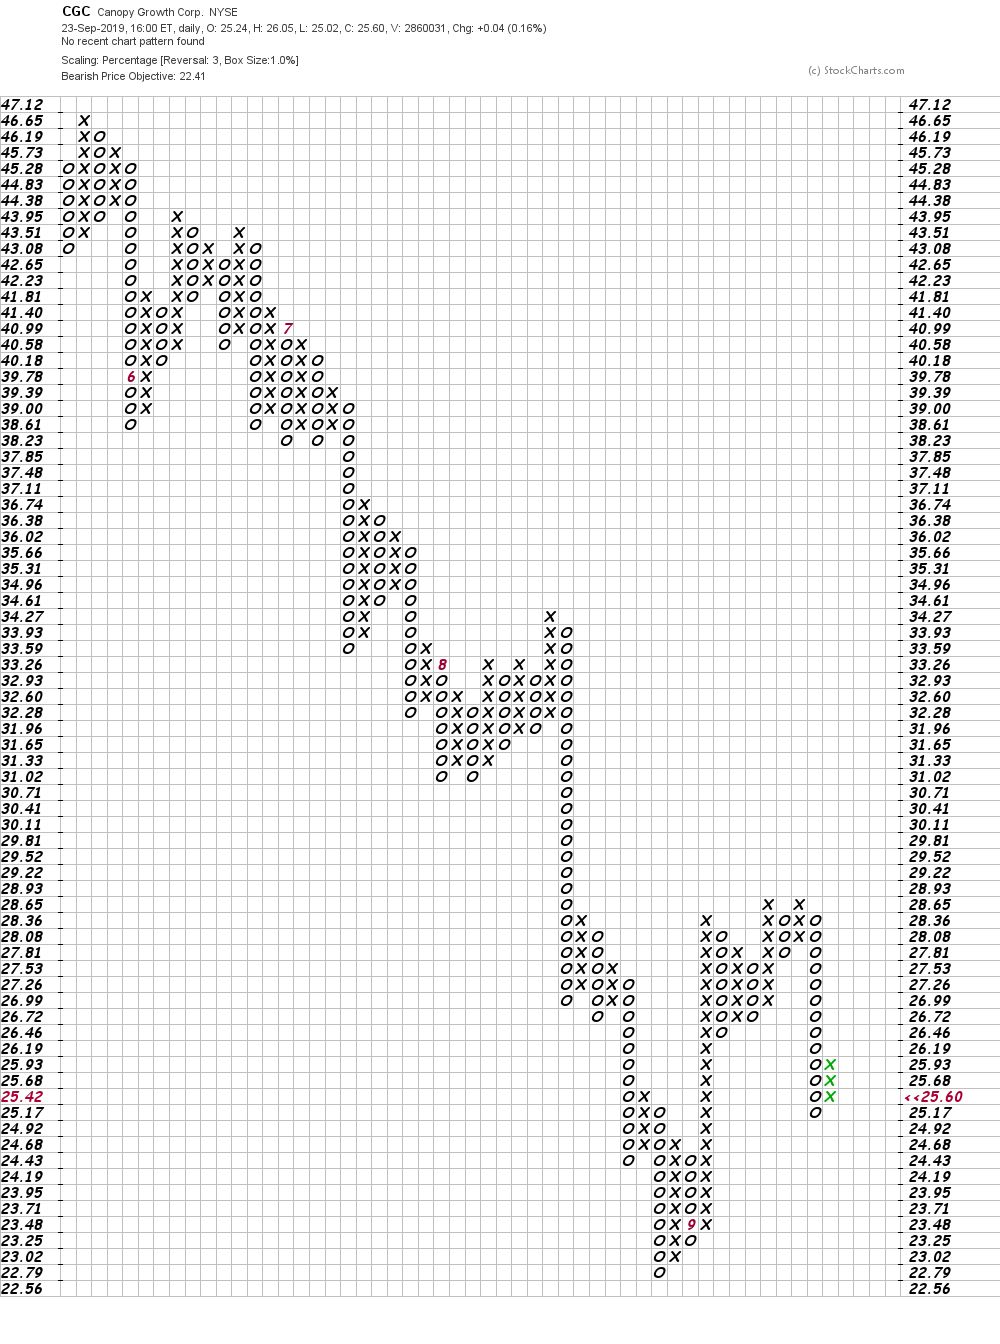
In this Point and Figure chart of CGC, below, we can see a downside price target in the $22 area or a new low for the move down.
Bottom line strategy: We looked at the charts of CGC a number of months ago and things looked positive but we recommended only going long on strength that never materialized. Now we don't see signs of accumulation so I would rate CGC an avoid for now.