FANG Stocks Update: Amazon Rally at Risk, Netflix Hanging By a Thread
With just a superficial glance it looks like the market's rolling again, led by the FANG stocks. The NASDAQ Composite jumped 0.87% on Monday, and while that doesn't carry the tech-heavy index to record highs, the S&P 500 accomplished that feat in today's action. Equally telling is that the Dow lost ground, implying traders are turning in their blue chips and swapping them out for more aggressive growth names.
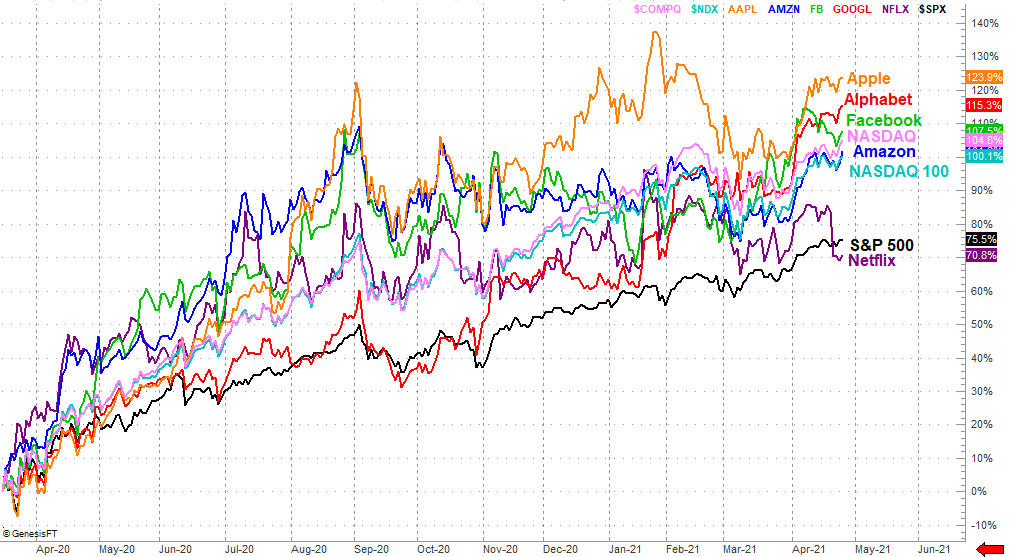
This FANG-led rally isn't being uniformly fueled by all the FANG names though, or the FAANG names if you count both Apple and Amazon. Indeed, Amazon itself is at a key make-or-break level, while Netflix is one misstep away from disaster.
But, first things first.
This is where the FANG names are since their mid-March low... from 2020. It's a surprisingly tight grouping thanks to Apple shares being reeled in back in February. It's bouncing back into the lead now, though Alphabet is the breakout candidate here. Netflix of course has been a lagged for some time now, but has been conspicuously absent from the rally effort that took shape late last week.
Here's a closer look at Netflix, and why it's hanging by a thread. Last week's big bearish gap following a disappointing earnings report dragged it under all of its key moving average lines, but didn't pull it below what's become a key technical floor (orange) that connects all the key lows going back to September. Until that support level breaks, the chance for a recovery remains in place. If the stock slides any lower, there's no more support to keep it propped up.
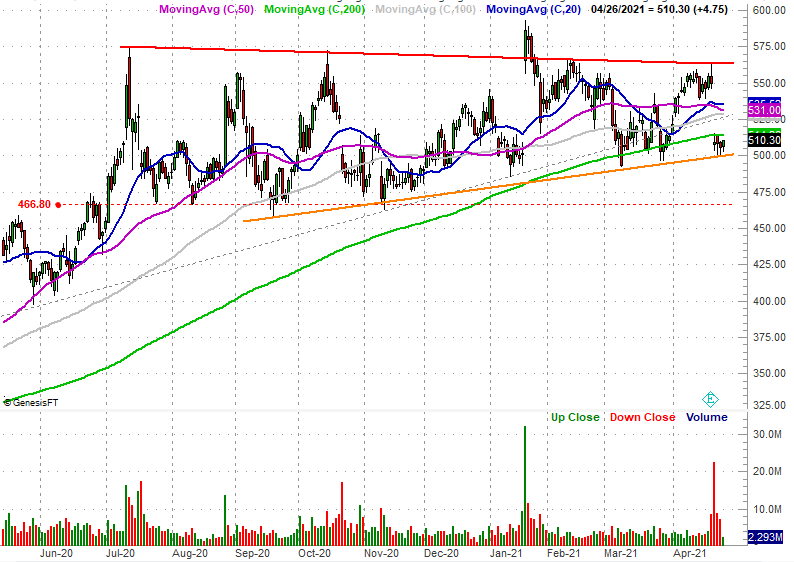
Those aren't the only red flags waving with Netflix here, however, that point in a bearish direction.
See the falling red line that connects all but one of the key highs since July's peak? That downward-sloped resistance coincides with the convergence of all the key moving average lines, which is an indication that the momentum is slowing. In fact, the 50-day (purple) and 20-day (blue) moving average lines are both close to crossing under the 100-day line (gray), and all are near breaking below the pivotal 200-day moving average line (green). That 200-day line, by the way, appears to have turned into a technical ceiling late last week after shares fell below it.
Working in the stock's favor is of course last week's bearish gap. The market doesn't like to leave gaps unfilled.
As for Amazon, it's been on a roll since late last month. Take a closer look though. Monday's high near $3438 is more or less in line with peak prices reached earlier this month, as well as in early February. None of these surges has broken that ceiling though.
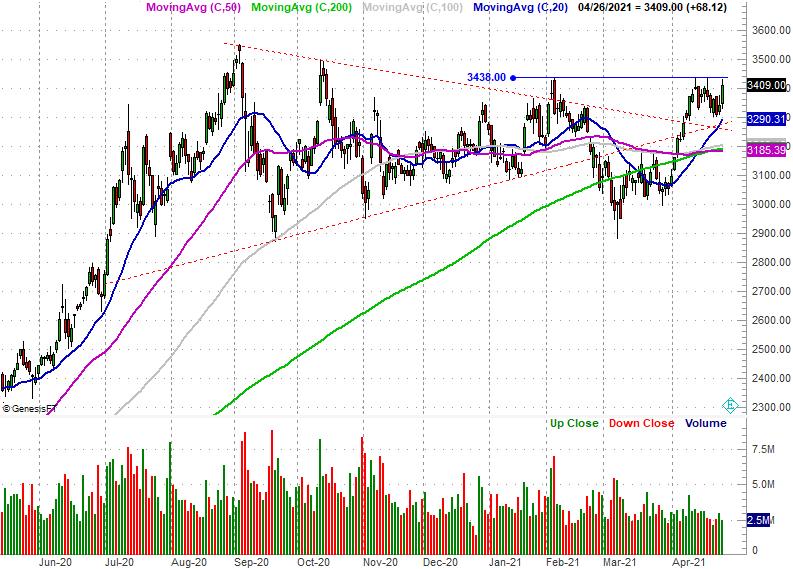
That doesn't necessarily mean it won't happen, but in many ways the chart's on the clock. The 50-day (purple) is now below the 100-day (gray) and 200-day (green) moving average lines, suggesting the bigger tide is a bearish one even if things don't look that way this month. If the bears take another swipe and drag Amazon shares back under that narrow band of technical support around $3186, they may not recovery as quickly if they recover at all.
And curiously, although the stock's been soaring since late last month, the volume behind the move remains pretty tepid. This isn't a move a lot of traders are getting behind. They may have the same concerns about being overbought that applies to a bunch of other stocks.
These are just observations, of course, and may or may not steer these stocks in their suggested direction. A chart's history does tell you a lot about what's likely in the foreseeable future though, so these are at least things to put on your mental radar.
If you'd like to leverage the power of FANG stocks, take a look at our FANG Options Advisory. Each of these stocks has their own characteristics and nuances, and we've tailor-made trading systems to capitalize on each one. You can plug into that potential. Learn more here.