
Stochastics Indicator
The stochastics indicator is in a group of technical trading tools considered oscillators, which travel back and forth (depending on price movement and speed of that movement) between overbought and oversold levels, and in some cases can indicate emerging trends.
The term 'stochastic' is a mathematical construct, commonly used in the field of statistics. In the arena of technical analysis, though, it's a reference to the value of a stock or index's current price relative to its price range over a particular time period.
Developed for trading purposes by George Lane in the 1950's, the goal was the creation of a tool that plots the pace of a stock's or index's movement, and then determines when that pace is slowing - suggesting a reversal - even if that stock or index has yet to start moving in the opposite direction. The fact that the stochastics indicator traverses a range between oversold and overbought levels, from a low reading of 0 to a high level of 100, is only coincidental, though the trading community has integrated the use of that scale into the application of stochastics as well.
The stochastics indicator generally uses two plots. The first plot is the %K line, while the second plot is the %D line. The formulas are as follows:
%K = (Current close - Lowest low over past x days)/(Highest high - Lowest low over past x days) * 100
%D = X-bar moving average of %K
An example, as always, clarifies the tool, its calculation, and how it's used.
VZ Daily Chart
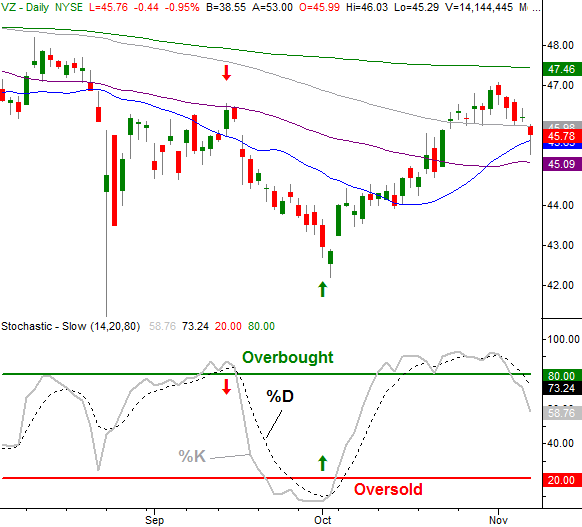
In the first example, we can see how the stock in question pulled back after both stochastic lines moved above the "overbought" threshold (80, in this case), but also rallied after both the %K and %D lines entered "oversold" territory (under 20). Note that while the chart reversed course once overbought or oversold in terms of stochastics, the timing of the reversals in question weren't precisely marked. Also note that just because a stock or index is overbought or oversold doesn't necessarily a reversal is imminent. An overbought stock or index can continue rallying, and a falling stock or index can keep sinking even if stochastically oversold.
YOKU Daily Chart
In the other example the overbought and oversold threshold lines are removed to better illustrate how crosses of the %K and %D lines can mark the emergence of new trends... bullish and bearish ones. All the crossovers and subsequent buys and sells are marked with arrows. Again, it's not a flawless tool, but is effective.
As is the case with any other technical analysis tool, the stochastics indicator is improved when used in conjunction with other, complementary tools.