Sector Shakeup: Healthcare Crashing, Technology Soaring
Since the December low, the marketwide rally has swept most stocks higher with it... pretty evenly, in fact.
Now approaching the four-month mark for the advance, however, we're finally starting to see some major divergences. That is, some sectors are remaining in a bullish mode, while others are reversing course. These trends are worth a closer look if only because they may point to the shape of things to come.
It's an exercise best approached simply, with a visual rather than a tabular look.
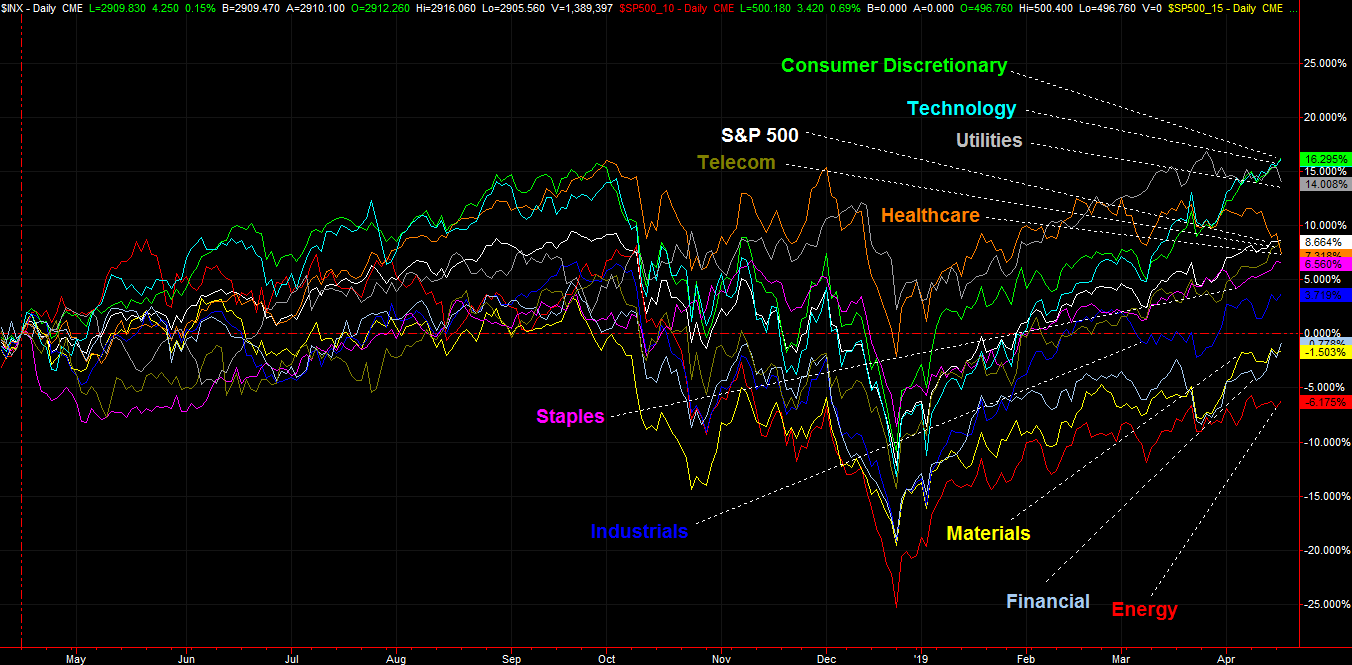
The graphic below does just that, plotting the performance-comparison of all the key sectors going all the way back to April 16th of 2018. Much us starting to change in a big way. Namely, technology stocks have just pulled ahead all other groups, while financial stocks (despite some ugly bank-stock performances this week) are heating up after hugging the bottom for the past several months.
The most interesting data here, however, is the performance of the utilities and healthcare sectors. Both had been doing exceedingly well, but both have hit a wall just in the past few days. Healthcare stocks, in fact, are crashing now, mostly in the wake of political uncertainty about what U.S. healthcare will look like in the foreseeable future.
This sector-based approach to trend-spotting is hardly a one-stop solution. It's one tool of many that should be used. These trends can reverse with little to no warning.
On the other hand, veteran traders know that once a trend gets going, it tends to remain in motion until there's a clear reason it comes to a halt.
And it's not just the large cap sector groupings that lend themselves to this exercise. You can do the same for mid cap and small caps sectors. While there are the expected similarities, there's enough difference too to make the time and work worth the effort.
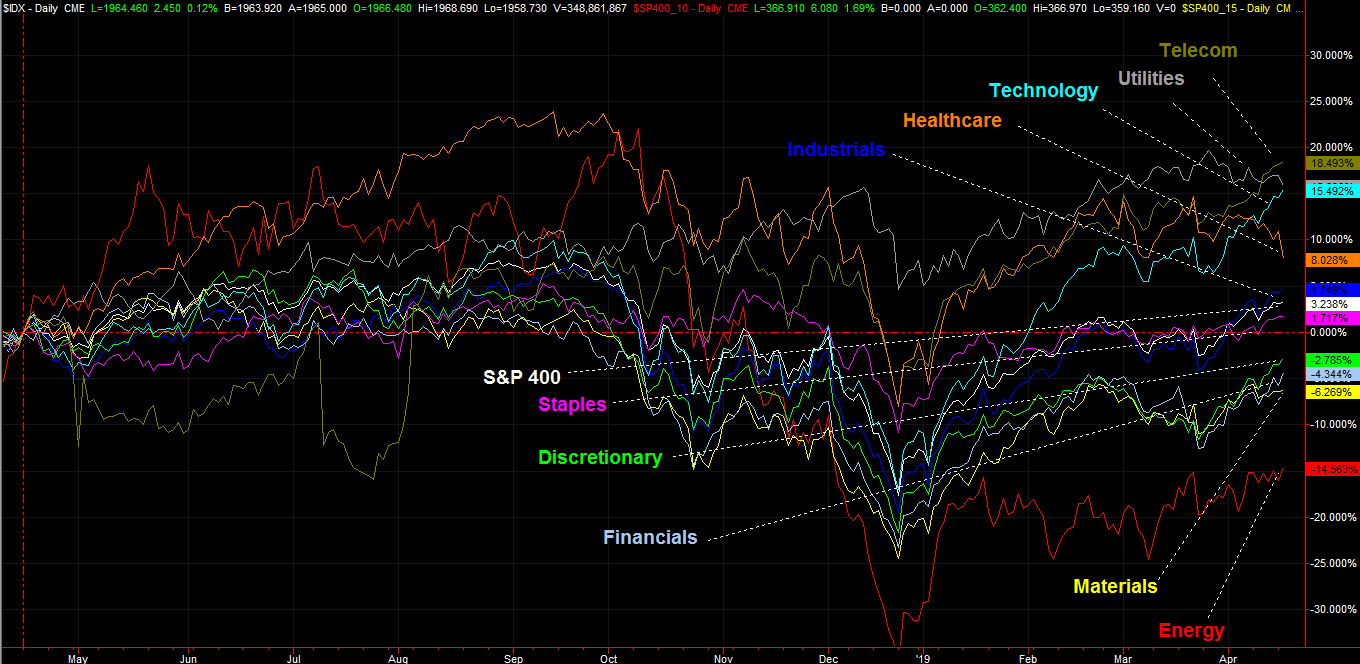
For instance, take a look at the sector breakdown among S&P 400 mid cap stocks. Utilities and healthcare are tanking here too, and technology stocks are rallying. But, telecom is actually the twelve-month leader here, and discretionary names have been sub-par performers. Mid cap energy names appear to be trying a little harder to rally than their large cap counterparts too.
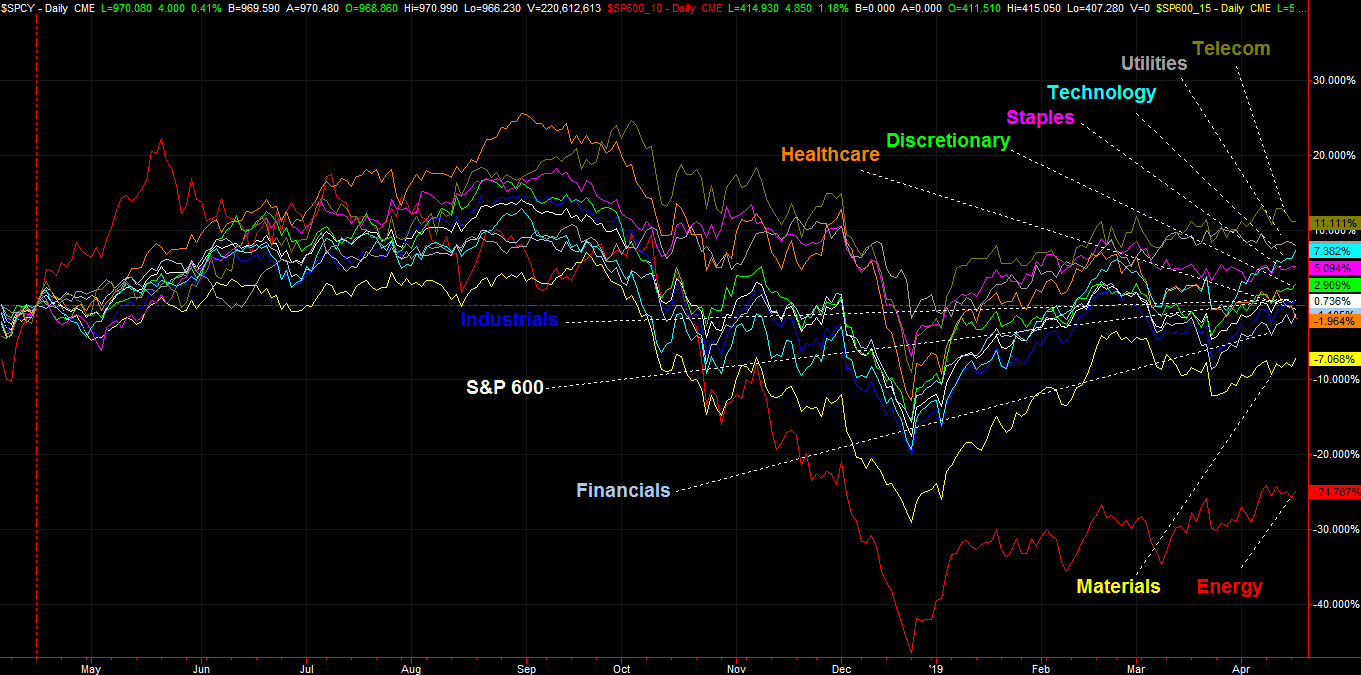
Small caps are basically in the same boat, though with some nuanced differences. That is, while telecom names have led here too, that lead is waning. Financials aren't exactly strong here as they are with other market cap groups. Tech names are roaring among small caps, and healthcare is imploding.
It's a lot of information to process, though the visualizations above makes it much easier to do so. More important, it's practical and applicable information to help pinpoint exactly where the market's strong and weak spots are. This data can be used to confirm or question other trading-related information.