Candlestick Pattern: Outside Day
An outside day is an important but simple chart pattern that any trader with access to stock or index charts can utilize right away as a means of spotting reversal pressure.
Simply put, an outside day is a two-bar pattern consisting of an open and a close that create a range that's above and below the prior day's open/close range, and a higher high AND a lower low on the second day compared to the first bar. True outside days also require intraday movement from the open to the close of the two days that is pointed in opposite directions (meaning one bar consists of a close above the open, and the other bar consists of a close below the open).
A pattern such as this suggests a sudden and long-lasting reversal has taken shape, and can be bullish as well as bearish.
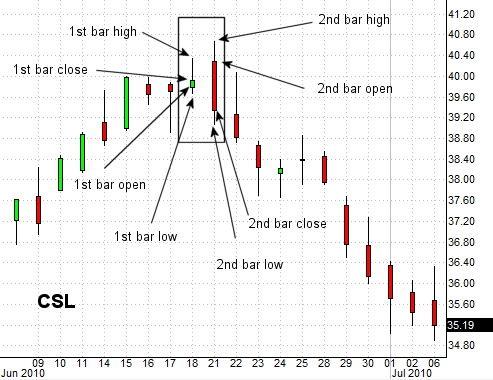
A couple of examples will best illustrate this important candlestick pattern. Take Carlisle Cos. (CSL) as an example. In the chart below, a key outside day following a fairly solid rally effort marked the beginning of a sizeable pullback. In this example, the open on the first day's close was above the open, and the second day's close was below the open (suggesting the reversal). AND, the second day's close was below the first day's open, AND, the second day's open was above the first day's close, AND the second day's high was above the first day's high while the second day's low was below the first day's low.
CSL Daily Chart
It seems like a lot of criteria, but they're not complicated once traders can visualize what they're looking for.
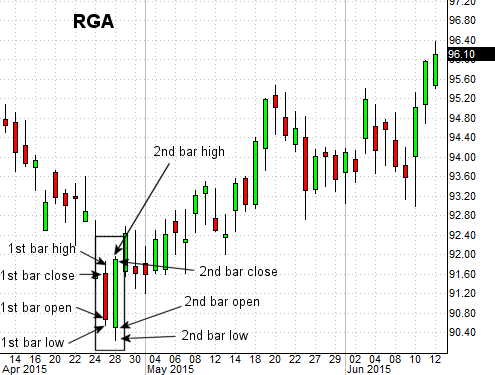
The outside day patterns is just as effective at spotting bullish reversals. For instance, on the chart of Reinsurance Group of America (RGA) below, a strong downtrend was quickly quelled when very bearish bar was followed by en even more bullish bar... a bar that started even lower than close of the first bar (and even made a lower low), but then made a sweeping reversal of that bearish first bar of the two-bar pattern.
RGA Daily Chart
It should be noted that outside days mean more - and are more reliable reversal signals - when they materialize after clear uptrends or downtrends. It's also important to know that perfect outside day reversals rarely exist; there's often one element of the criteria left unsatisfied. That doesn't mean a near-signal should be dismissed as untelling, however. The spirit of the signal is the identification of a sudden and strong change in the direction traders are pushing a stock or index.