Opinion: Technical charts signal a faster march to S&P 3,000
- After the S&P 500's move above 2,850 this month, the stock market's next target is the 2,993 region -
There is no question that our expectation years ago was that the S&P 500 was likely destined to strike 3,000 and beyond in the coming years. However, I certainly didn't expect it to strike that region in the first half of 2018. Yet the market seems as though it is on a path to do exactly that.
With the S&P 500 attaining the 2,850 region in January, I have noted that I would have to strongly consider the more aggressive bullish pattern I presented a few weeks ago, despite the lack of standard pullbacks in the pattern I would have to adopt to support such a move. While I would normally view such a pattern as a lower probability, sometimes lower-probability patterns do play out. And with a pattern that has not seen more than a .236 retracement in two years, it is not something we often see in the equity market. Yet that is clearly what we are now being presented with. [Click on image to see full-screen view.]
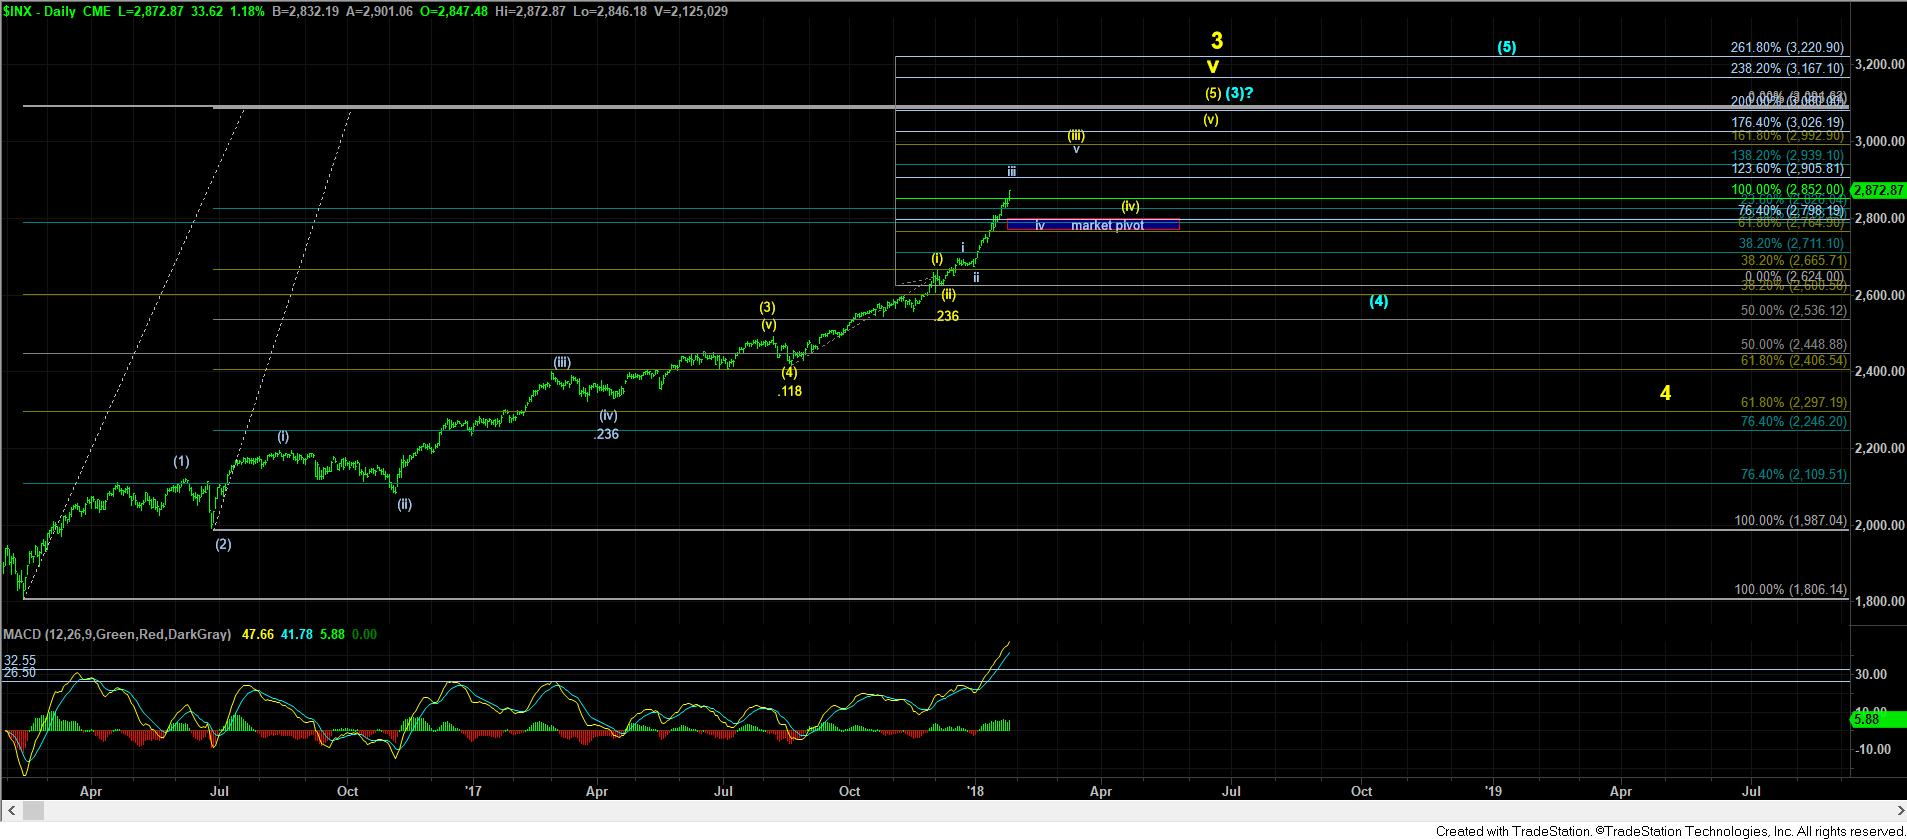
Currently, I would have to view the market as soon completing a wave iii of (iii), as presented on the daily chart. Moreover, support in the SPX has now been raised to the 2,765-2,800 region. Furthermore, due to the market seemingly wanting to approach the 1.236 extension (2905) in this current structure off the August 2017 pullback, it would mean that the 2,800 SPX region is now support for the market targeting the 3,026 region within the first half of 2018.
And, as long as the next pullback doesn't break below 2800 on the SPX, the next main target I have on this chart is the 2,993 region. It would take a sustained break of the 2,765 region to change this perspective, and suggest a larger degree wave (4) is already underway.
While I see signs in other areas of the market that may suggest this more aggressive bullish stance in the SPX may not attain 3,000 in the current structure, I am simply unable to set aside the clear strength seen in the technicals along with the extraordinary extensions being developed weekly by this market. So, until we see at least a sustained break of the 2,800 region, with follow-through below 2,765, I have to view the path as taking us to 3,000 sooner rather than later much more realistically. [Click on image to see full-screen view.]
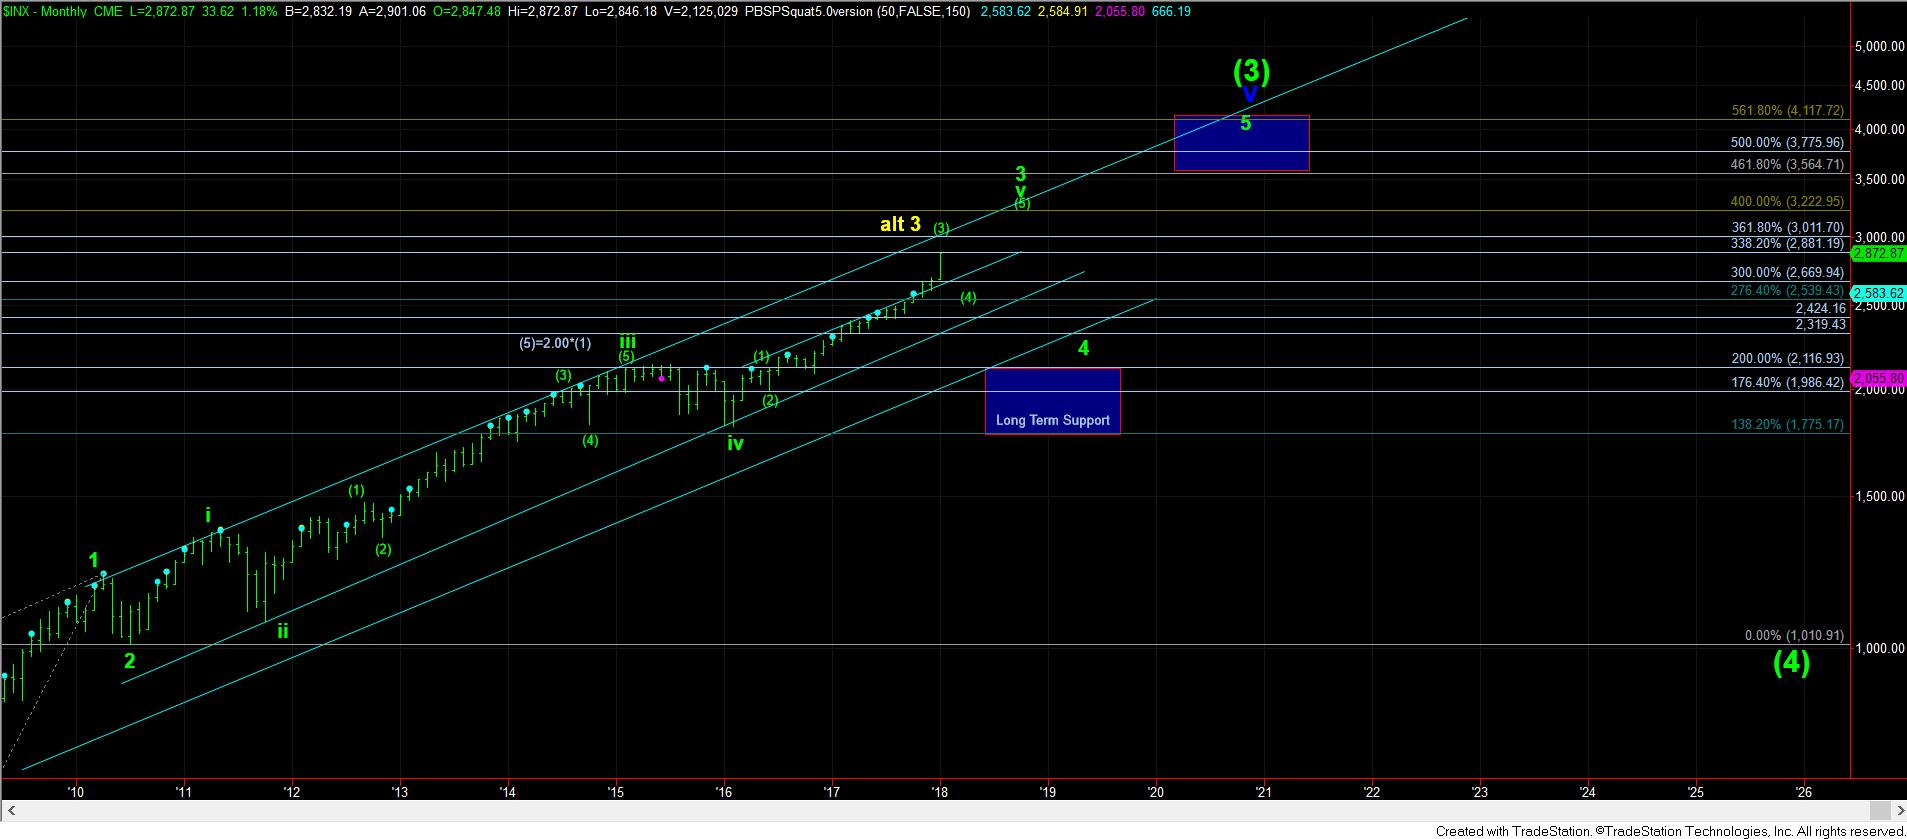
The bigger question with which we will have to grapple should we rally onto the 3,000 region in the coming months is if this rally is still wave (3) of v of 3 on the monthly chart or if it completes all of wave 3. Ultimately, it will depend on whether the market will respect the .382 retracement of this current rally or not. If it does not, then we will likely see a 15-20% market pullback potentially beginning in the second half of this year. So, we will address this issue in the second half of 2018. Yet, in either case, it would seem there is a strong support in the SPX between 2,400-2,600 in the coming years, as the market is likely now pointed up toward the 3,500+SPX region by the early 2020s, which still has been our expectation for years.
From MarketWatch
Avi Gilburt is a widely followed Elliott Wave technical analyst and author of ElliottWaveTrader.net, a live Trading Room featuring intraday market analysis on U.S. indexes, stocks, precious metals, energy, forex, and more, along with an interactive member-analyst forum and detailed library of Elliott Wave education.