Opinion: Stock market bulls get their biggest warning yet

- The S&P 500 may already have topped, though there could be one more push higher -
For the past year, the U.S. stock market has had one of the strongest rallies in a long time. It has rallied 20% since Donald Trump was elected, and it took most of the market by surprise.
However, those who followed our analysis a year ago know we were expecting the market to bottom just before the election, and begin a rally to the 2,537-2,611 region on the S&P 500 (SPX). Currently, we reside at the upper end of that target region.
But our expectations for this rally began much earlier than the election. My initial expectation in 2015 was that all 5 waves off the February lows would potentially complete in the 2,611-point region on the SPX. But when the market provided us only with a high-level pullback in August, it suggested that the wave (3) off the February lows was extending up toward the upper end of our target zone.
Last Thursday’s action
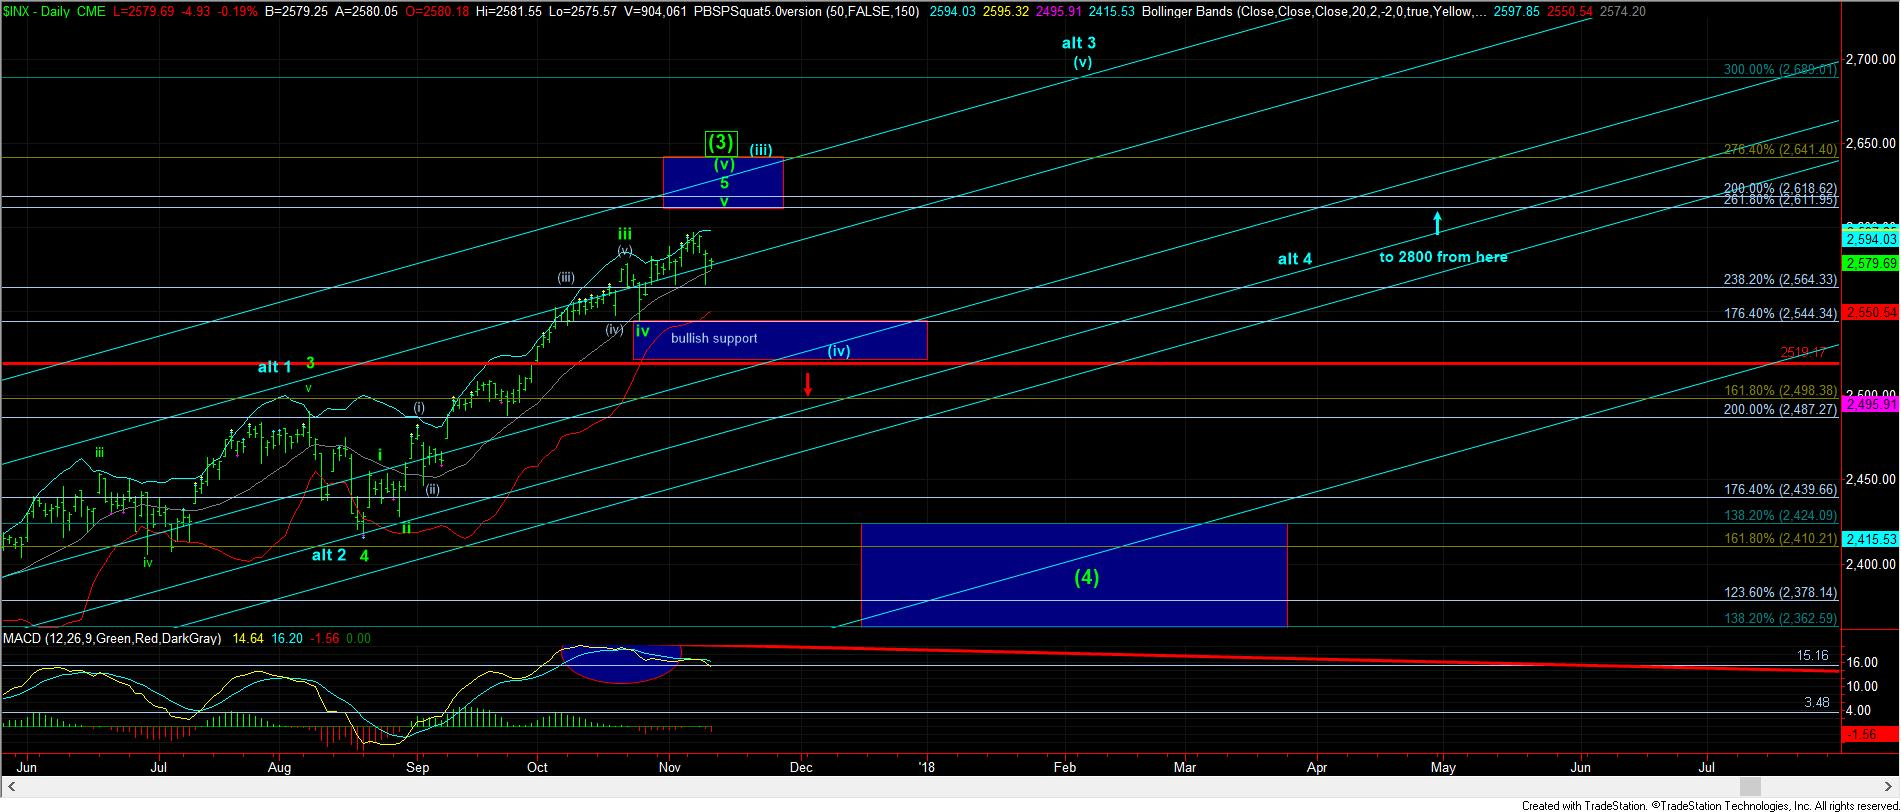
As you can see from the attached daily chart of the SPX, this rally off the August lows is filling in quite nicely. However, we now have the minimal number of waves in place to consider it complete, even though we have not yet struck the target box on the daily chart. Moreover, the action seen last Thursday (Nov. 9) dropped us to within pennies of the bottom of our short-term support region, and could suggest that the SPX may have already topped in the rally off the August lows.
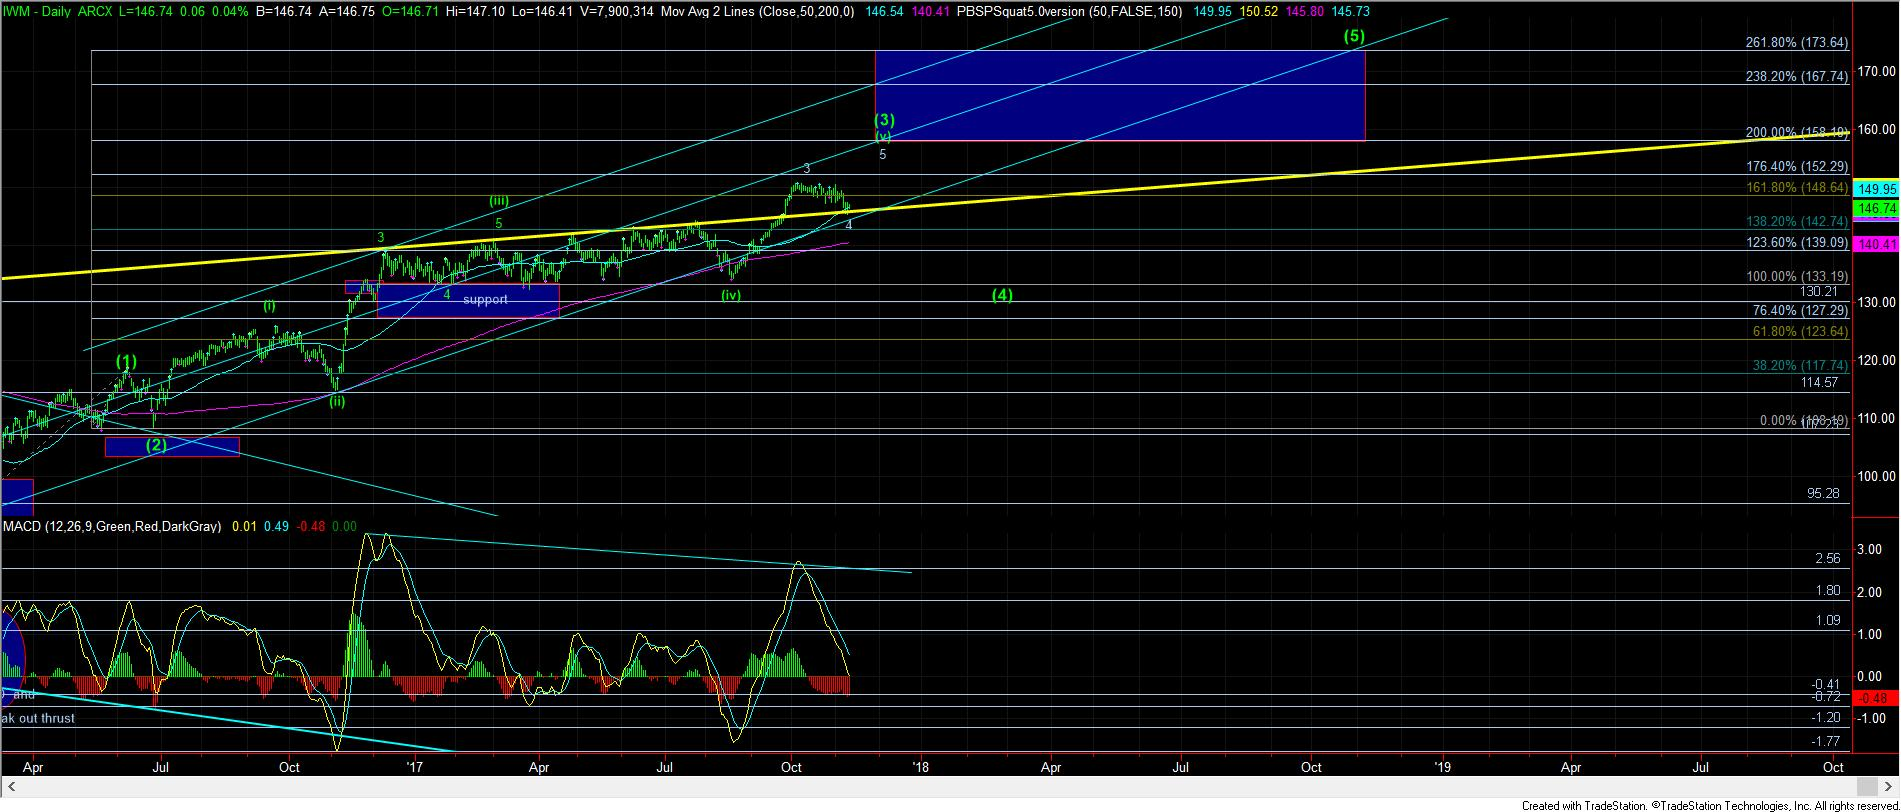
However, as I have been pointing out over the past week, the iShares Russell 2000 Index ETF (IWM) does not look like it has topped. Rather, the 60-minute and daily charts both suggest that the IWM has one more rally left before I can consider that the top of the rally off the August lows has completed. As I noted in my Thursday night update:
“The daily chart really shows only a solid 3 waves up, right into the 1.764 extension of waves 1 and 2. The current pullback has taken us back toward the 1.00 extension for waves 1 and 2, which is just slightly below the .382 retracement of wave 3. This is the general target region for a 4th wave in an impulsive Fibonacci Pinball structure, so this is following a typical Fibonacci Pinball structure. With the pullback currently taking us to exactly where a 4th wave would normally expect to pull back, my primary count remains that this is wave 4, with a 5th wave to new all-time highs in IWM yet to come.
“Moreover, if you look at the daily IWM chart, you will see that the August rally broke out through a trend line which has held the IWM in check since the 2014 high. Moreover, each time we have struck that trend line, the market has pulled back strongly. After breaking out of a long term trend line, as we did with the August rally, the market is now coming back to test that break out region from above, which is also quite typical of bull markets, right before they begin the next rally. In our case, that next rally counts best as a 5th wave to new highs.”
Caution is required
So while it is certainly possible the SPX “may” have topped, the IWM is still suggestive of one more rally. Yet, as long we are able to hold over Thursday’s pullback low in the SPX, we can still reach our target box on the daily chart. But, we have now moved up to a point in the market where caution is finally needed in the SPX. In fact, my expectation is that we will likely re-test the 2,520-2,550 region once this rally has completed, and should we break the 2,520 region of support, that will provide confirmation that the larger wave (4) pullback off the February 2016 lows is in progress. And, our target region for that wave (4) takes us down to the 2,330-2,400 region.
In our bigger perspective, as long as the 2,300 region holds on that pullback, this pullback will only set up the next rally phase in the market with our target between 2,800 and 3,000 on the SPX, depending on how the extensions in that rally take hold.
Ultimately, our expectation is that we will likely see the 2,800 region before a much larger degree correction takes hold. It means that this bull market likely has several more years to run, yet, I think we are approaching a topping region that can provide us with a much larger pullback first.
See charts illustrating the wave counts on the SPX and IWM.
Avi Gilburt is a widely followed Elliott Wave technical analyst and author of ElliottWaveTrader.net, a live trading room featuring intraday market analysis on U.S. indices, stocks, precious metals, energy, forex, and more, along with an interactive member-analyst forum and detailed library of Elliott Wave education.
From MarketWatch